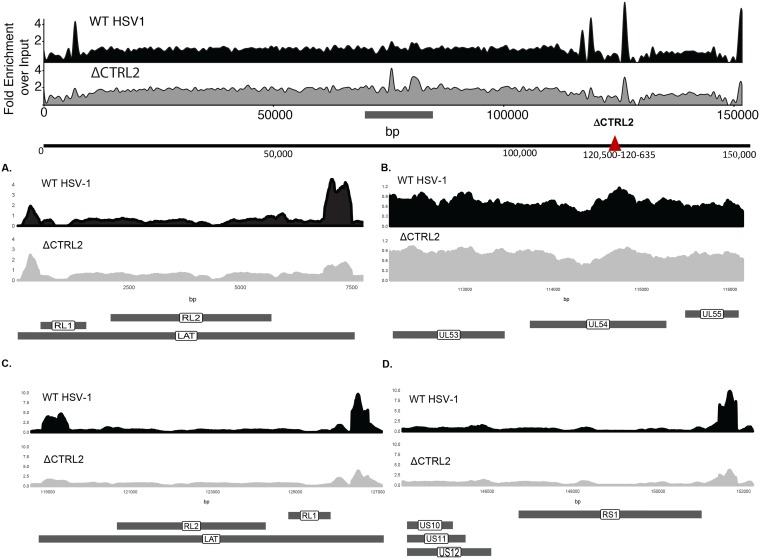
FIG 6.
ΔCTRL2 affects H3K27me3 occupancy. The schematic at the top of the figure represents ChIP-seq signals of merged experimental replicates (n = 6). H3K27me3 wild-type 17syn+ and ΔCTRL2 signals from TG of latently infected mice were quantified. Both signal tracks were calculated using all 6 inputs combined for either the wild-type 17syn+ or the ΔCTRL2 viruses. The patterns of H3K27me3 signals were similar between the wild-type 17syn+ and ΔCTRL2 viruses; however, there was differential H3K27me3 enrichment at distinct genomic regions. There was 2- to 4-fold H3K27me3 enrichment at the LAT 5′ exon and ICP0 (RL2) regions (A and C) compared to the level for the wild-type 17syn+ and a slight decrease (less than a 1-fold change) in the ICP27 (UL54) region (C). In addition, there was a 2-fold decrease in H3K27me3 enrichment at the CTRS3′ element upstream of the ICP4 promoter region (RS1) (D) and an increase (0.5- to 2-fold) of H3K27me3 enrichment in the ΔCTRL2 virus at the UL36 and UL37 sites located between nt 70000 and 90000 (in the schematic at the top, the horizontal line below the sequence denotes where the histone marks differ between the two viruses). Data in panels represent merged experiments using 3 mice and 6 TG each (n = 6). Data are plotted as fold enrichment over input for all panels.

