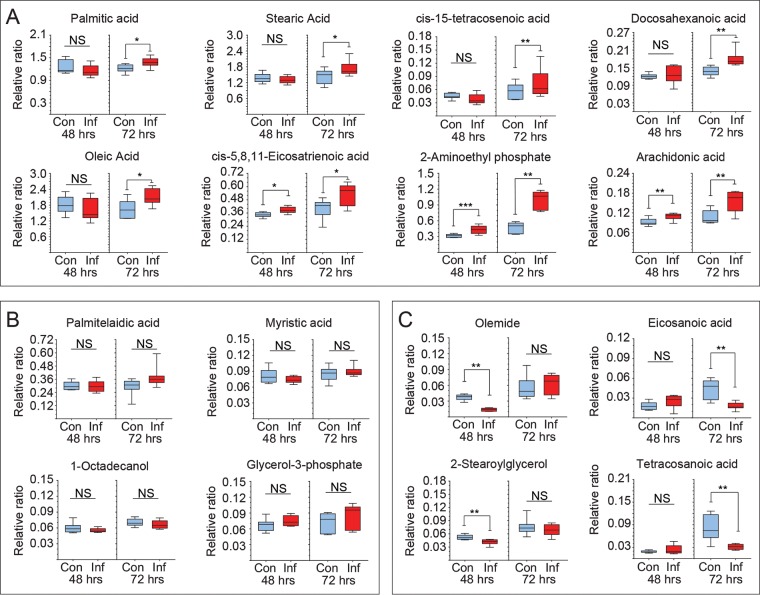
FIG 1.
Alteration of fatty acid and arachidonic acid in MDV-infected CEFs. Metabolomics analysis of relative ratio (ratio of area to internal standard) of lipid metabolites from mock (control; Con)- and MDV (RB1B; Inf)-infected CEFs are shown at 48 hpi and 72 hpi. Box and whisker plots show minimum and maximum relative levels of named lipid metabolites that are increased (A), show no change (B), or are decreased (C) in MDV-infected CEFs. Nonparametric Wilcoxon tests (Mann-Whitney) were used to assess normal distribution and test significance, with the results shown as means ± SD. * (P = 0.01), ** (P = 0.001), and *** (P = 0.0005) indicate a statistically significant difference compared to the control. NS, no significant difference. The experiments were performed in biological triplicates with six technical replicates per biological replicate.

