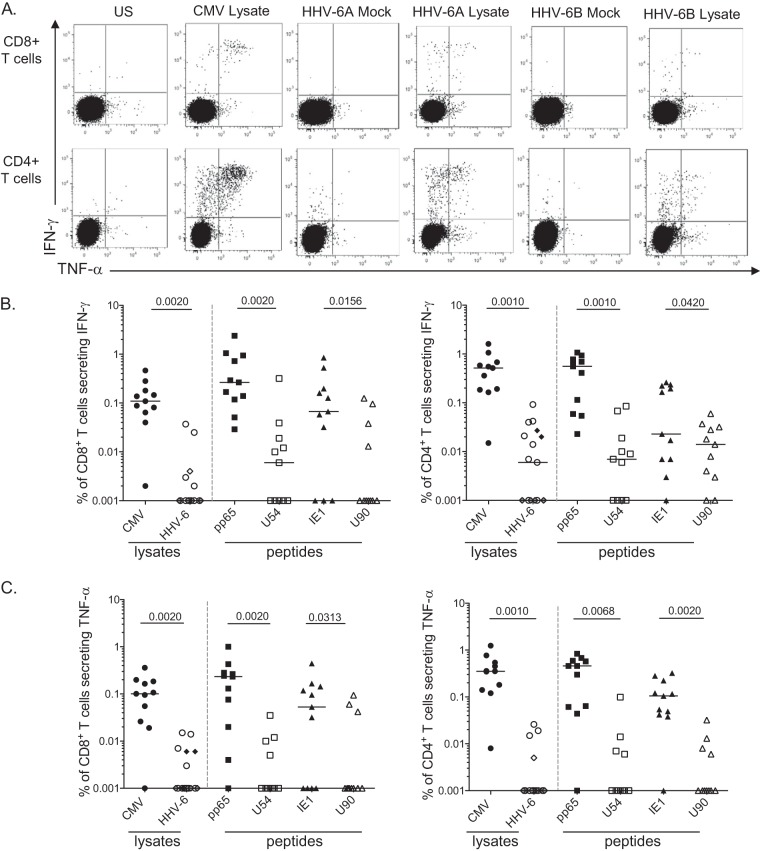
FIG 1.
Frequencies of HHV-6-specific CD4+ and CD8+ T cells. (A) Representative flow cytometry dot plots showing the frequencies of HCMV- or HHV-6-specific CD8+ (top) and CD4+ (bottom) IFN-γ- and/or TNF-α-responding T cells after overnight stimulation with the appropriate lysates. Frequencies of IFN-γ-secreting (B) or TNF-α-secreting (C) HCMV- or HHV-6-specific T cells are depicted. Overnight stimulation was performed using either viral lysates (HCMV, •; HHV-6A, ○; HHV-6B, ♦) or overlapping peptides (pp65 and U54 values are denoted by squares, IE1 and U90 values by triangles), and the frequencies of responder T cells are shown for CD8 (left) or CD4 (right). Each symbol represents a donor (coinfected by HHV-6 and HCMV), and horizontal bars indicate the medians. P values were calculated using the Wilcoxon pair test for group comparisons.

