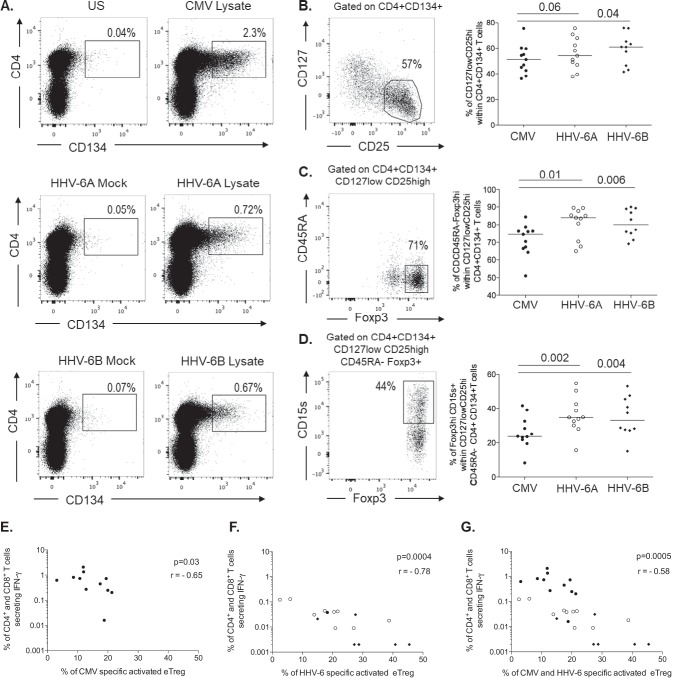
FIG 3.
Induced specific Treg phenotypes. (A) Representative flow cytometry dot plots showing the frequencies of activated CD134+ CD4+ T cells observed poststimulation with either HCMV lysate or with HHV-6A/HHV-6B lysates and their respective negative controls (unstimulated or mock lysates). (B to D) Gating strategy used to identify the frequencies of Treg subsets defined with the expression of CD127low CD25high (B), CD45RA− Foxp3high (C), and CD15s+ Foxp3high (D) effector Tregs (eTregs). Their respective frequencies are summed up for HCMV (•) or HHV-6-induced (HHV-6A, ○; HHV-6B, ♦) specific Tregs. Each symbol represents an individual donor, and horizontal bars indicate the medians. (E to G) P values were calculated using the Wilcoxon pair test for group comparisons. Correlations between the frequency of IFN-γ-secreting effector T cells and the frequency of induced eTregs specific for either HCMV (•) (E), HHV-6 (HHV-6A, ○; HHV-6B, ♦) (F), or pooled specificities (HCMV and HHV-6) (G). The correlation coefficients were derived from Spearman analyses.

