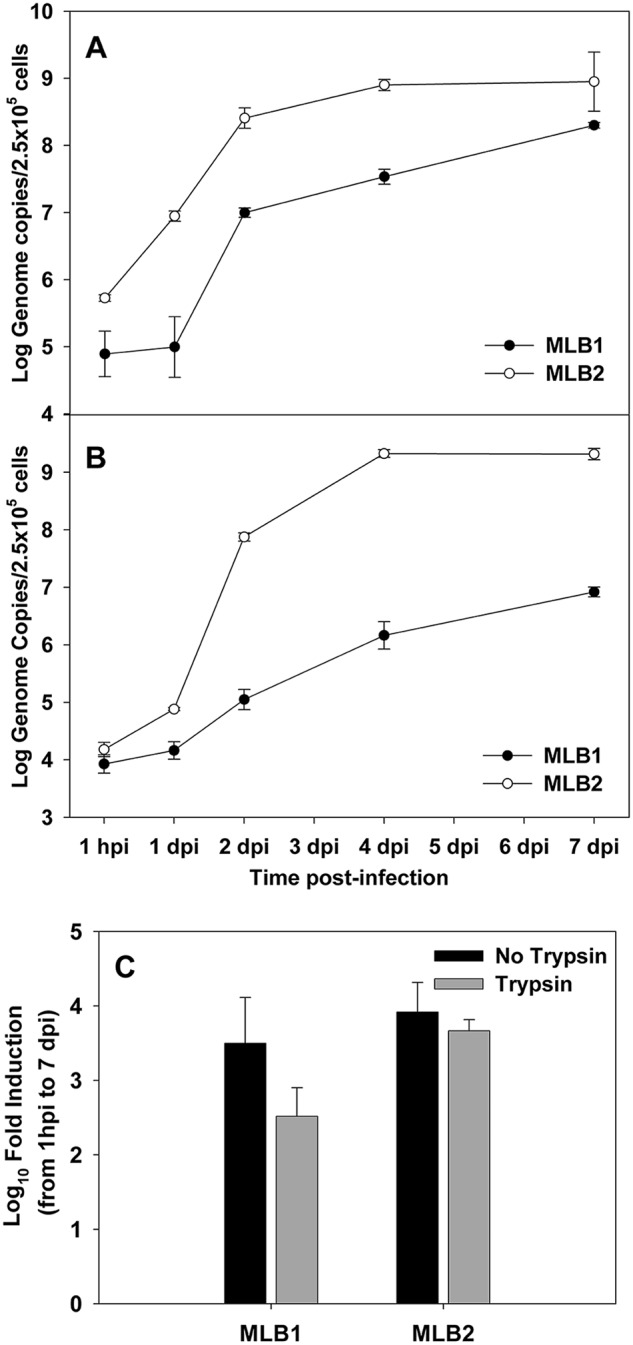
FIG 3.

Multistep growth curves of MLB1 and MLB2 on Huh-7.5 cells. Cells were infected using a multiplicity of infection of 20 genome copies/cell, and viral RNA was measured from the cellular (A) and supernatant (B) fractions. Plot shows average values, and error bars indicate one standard deviation from triplicates. (C) Viral replication with or without trypsin for MLB1 and MLB2 on Huh-7.5 cells. Viral replication is expressed as the fold induction of viral genome titers in the SN of infected cells from 1 hpi to 7 dpi. P values comparing fold inductions with and without trypsin for each genotype were not significant (by Mann-Whitney test). Plot shows average values, and error bars indicate one standard deviation. Samples were quantified in duplicate from a single experiment.
