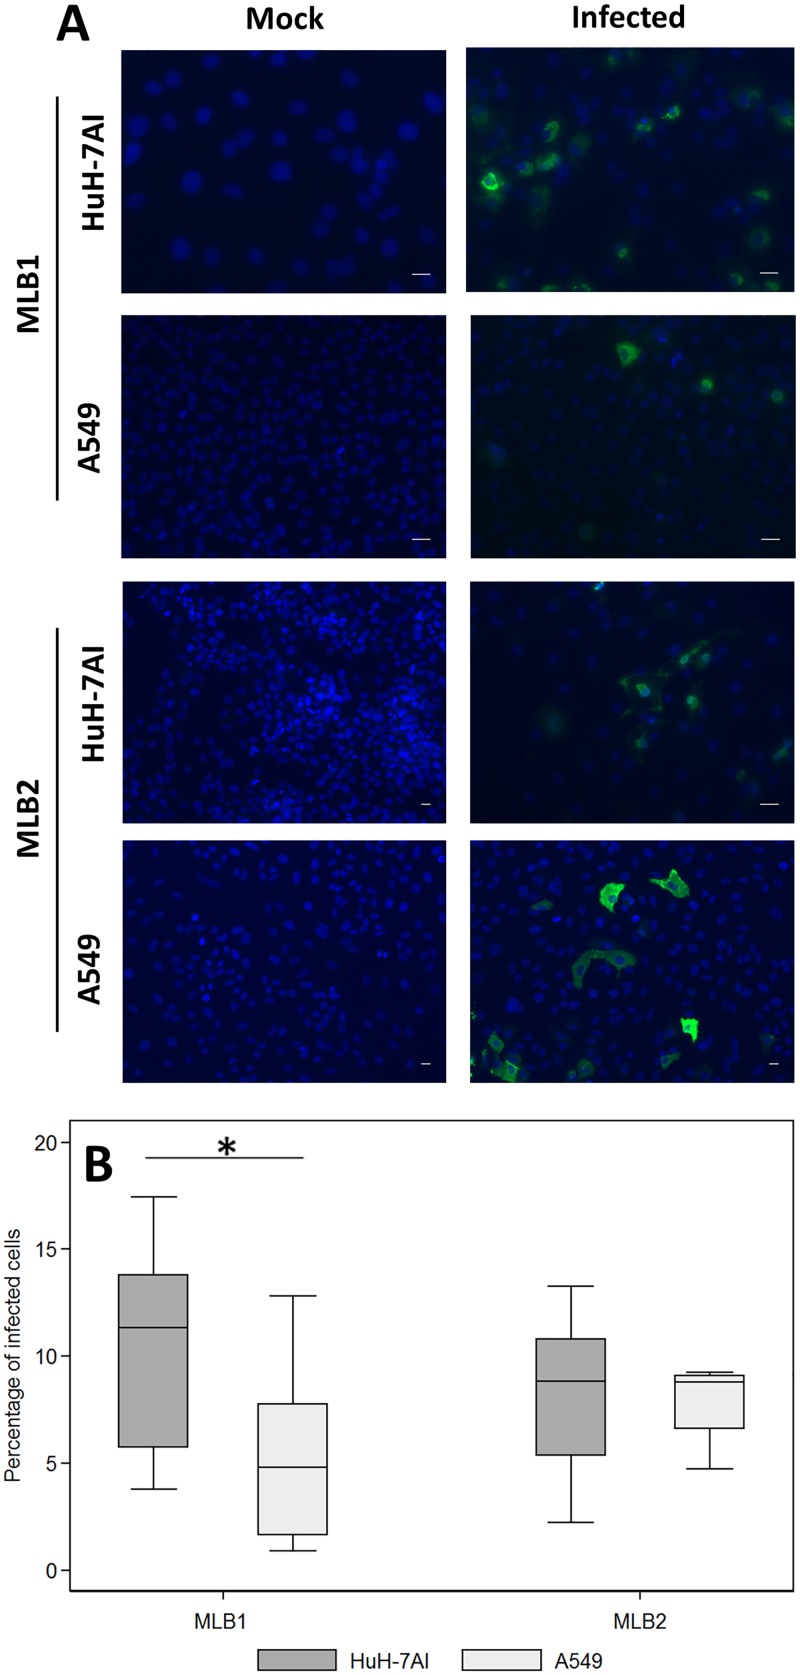
FIG 6.
Immunofluorescence assay of MLB1 and MLB2 persistently infected cell lines. (A) Infected and noninfected (mock) cultures were fixed at confluence and were incubated with primary (anti-MLB1 and anti-MLB2 antibodies, respectively) and secondary antibodies. Green corresponds to the viral capsid proteins, and blue corresponds to the nuclei. All samples were fixed at 3 to 5 days postseeding (magnification, ×10 to 20). (B) Estimated proportion of persistently infected cells visualized by the immunofluorescence assay. Central line of each box plot represents the median. Each box plot includes data from 7 to 12 fields from 2 different cell passages. For HAstV MLB1, the proportion of Huh-7AI-infected cells was significantly higher than the proportion of A549 cells (*, P = 0.0267, Mann-Whitney test). Bars = 25 μm.

