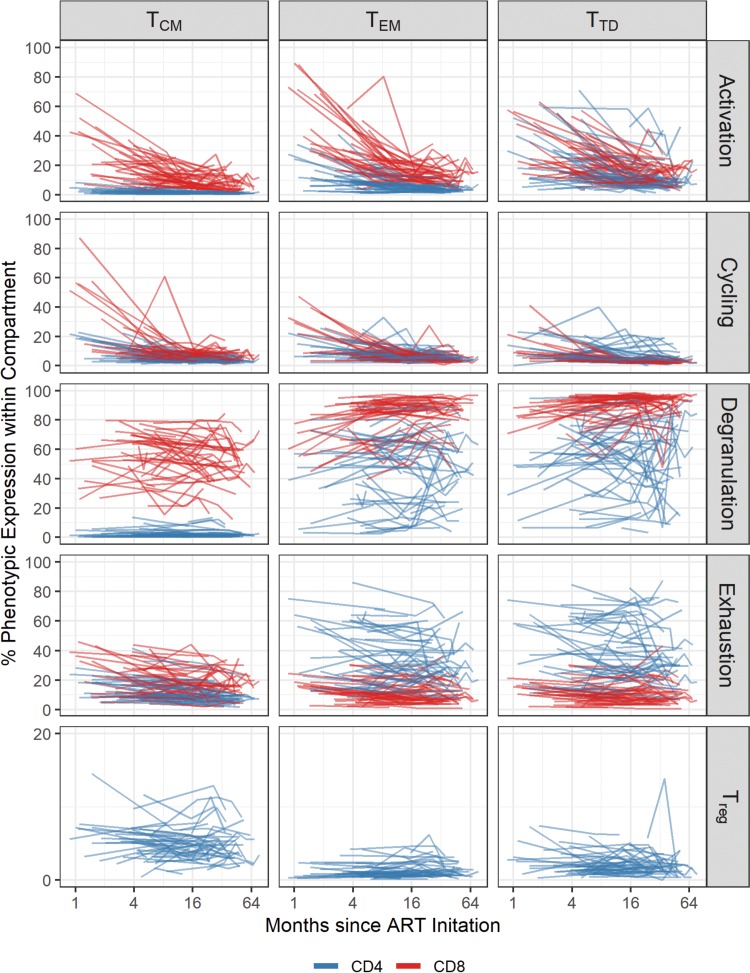
FIG 1.
Longitudinal analysis of the expression of different immunological markers during ART. Levels of each marker in each CD4 and CD8 T cell subset were log transformed and applied to the x axis (time on ART). Each line indicates one subject, and blue and red lines indicate CD4 and CD8 T cells, respectively. Memory subsets analyzed included central memory (TCM), effector memory (TEM), and terminally differentiated (TTD) T cells. We included the longitudinal analysis of levels of activation (HLA-DR+ CD38+), cellular cycling (Ki-67+), degranulation (CD107a+), and PD-1+ in CD4 T cell subsets, as well as the frequency of T regulatory cells (Treg [Fox-P3+ CD25+]).

