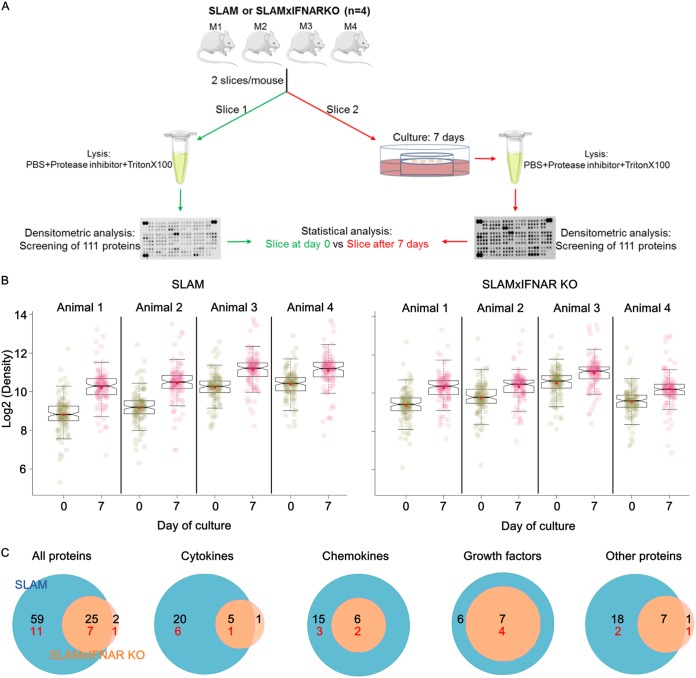
FIG 4.
Global overview of the proteomic analysis of SLAM and SLAM × IFNARKO mouse OBC over 7 days of culture. (A) Schematic overview of the experiment. The SERVIER Medical Art image bank (Creative Commons 3.0; https://creativecommons.org/licenses/by/3.0/) helped to create this image. (B) Box plots show the expression range and individual values for the 111 secreted proteins included in the proteome array (n = 4). The notches in the box plots represent the median 95% confidence intervals, and red dots represent the expression average. The closeness between the mean and median values argues for a Gaussian distribution for protein production. (C) Venn diagrams account for statistically significant proteins that are either common to both mouse strains or specific to each mouse strain and clustered in 4 main protein classes. The numbers of proteins so far considered markers of astrogliosis are shown in red.

