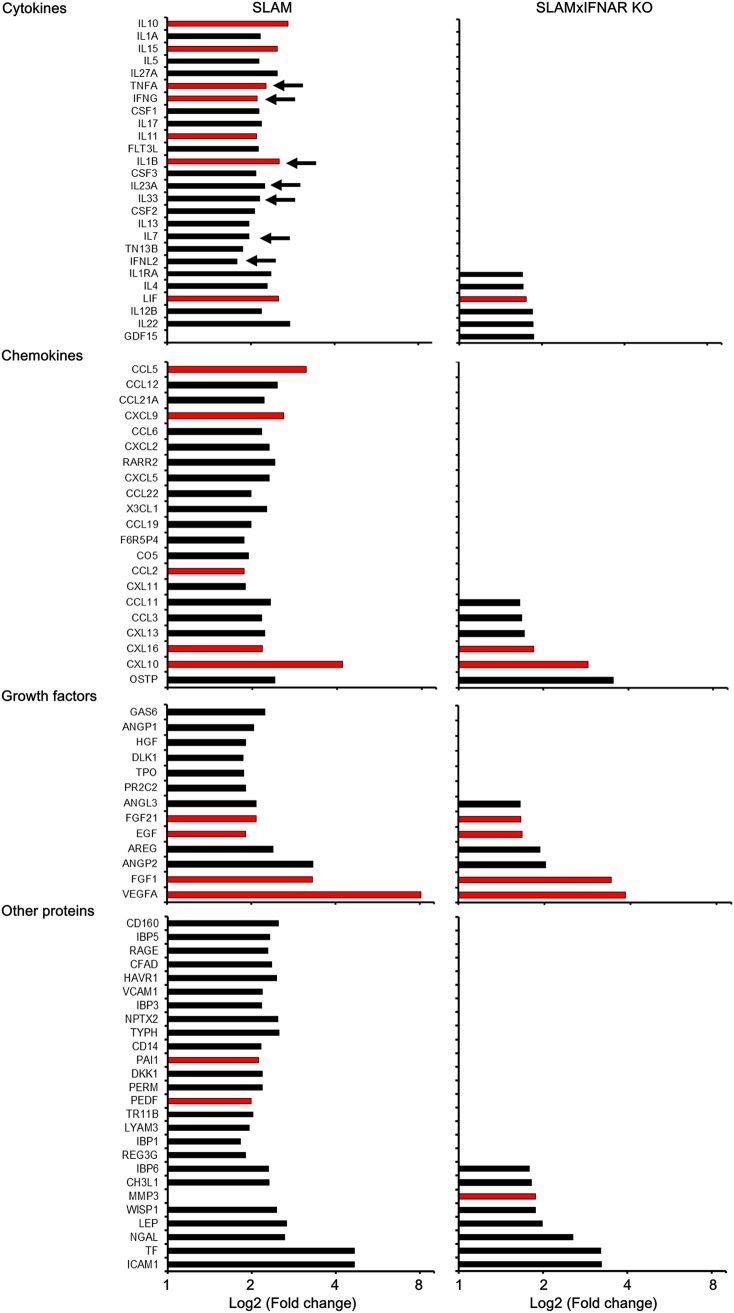
FIG 5.
Proteomic analysis of SLAM and SLAM × IFNARKO mouse OBC over 7 days of culture. This graphic displays only the proteins that showed a statistically significant difference in their expression between day 0 and day 7. The proteins here are ordered by increasing log2 fold change in expression observed in SLAM × IFNARKO mouse OBC and are grouped by protein class; day 0 is the reference time point. Red bars indicate proteins related to astrogliosis. Arrows indicate genes known to be involved in antiviral effects. Proteins differentially expressed between day 0 and day 7 were determined with the linear model approach from the Bioconductor limma package. Analyses were completed for each mouse strain separately (n = 4 mice at each time point). Data were paired by animal, and P values were corrected for multiple testing with the Bonferroni adjustment method. A difference was considered significant when the adjusted P value was <0.05.

