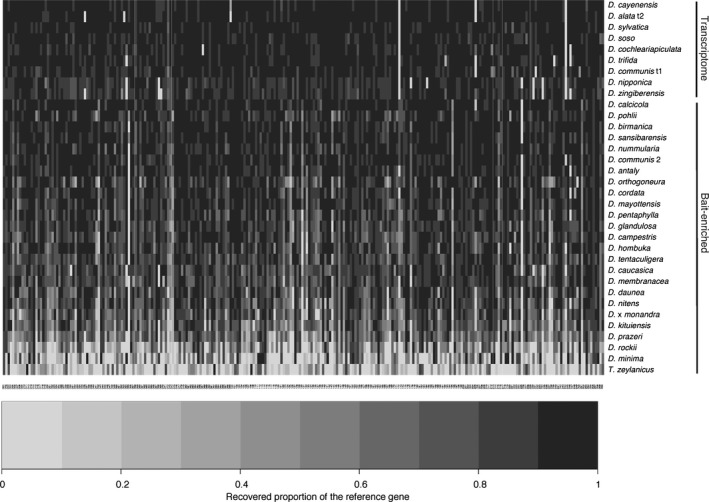
Figure 1.

Proportion of total reference gene length recovered per gene and taxon. Rows correspond to taxa, and columns correspond to a gene target. Target enrichment using the Dioscorea‐specific baits designed here was performed on 25 taxa. Gene recovery for nine species with transcriptome‐based data (not including the four transcriptomes used for bait design) is also shown here, see upper set of taxa in figure. Recovered proportions of the reference gene are indicated by shading.
