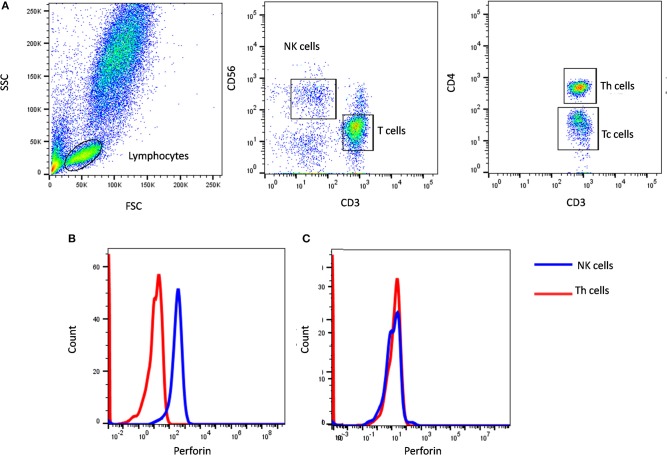
Figure 1.
Perforin expression on NK cells. (A) Samples were analyzed by flow cytometry, gating on lymphocytes by forward/side scatter. Perforin expression was analyzed on natural killer (NK) cells (CD56+CD3-) (blue histogram) using T helper cells as internal negative control (red histogram). Perforin expression results are shown from (B) a healthy control and (C) FHL2 (Perforin deficient) patient.

