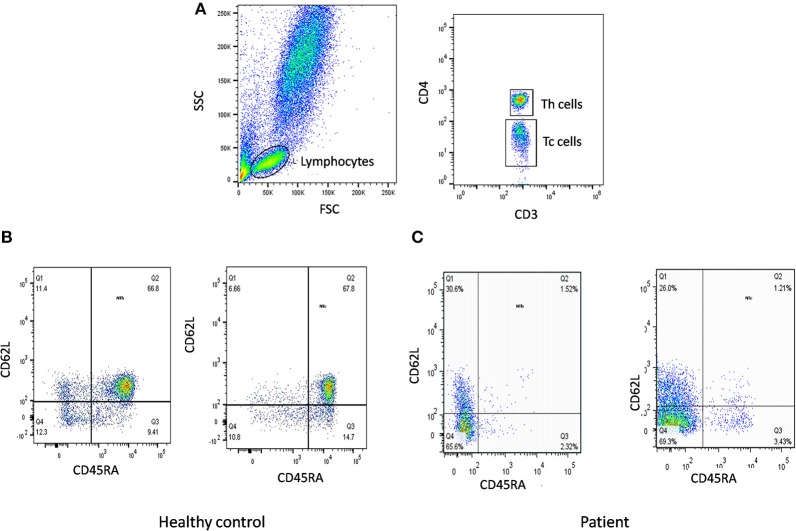
Figure 5.
Naïve T cells analysis. (A) Samples were analyzed by flow cytometry, gating on lymphocytes by forward/side scatter. Tc and Th cells were gated as CD3+CD8+ and CD3+CD4+, respectively. Naïve T cells were gated as CD45RA+CD62L+ on Th cells and Tc cells. Figure represents Naïve T cell population in (B) healthy control (C) SCID patient. SCID patients had low percentages of naïve T cells.

