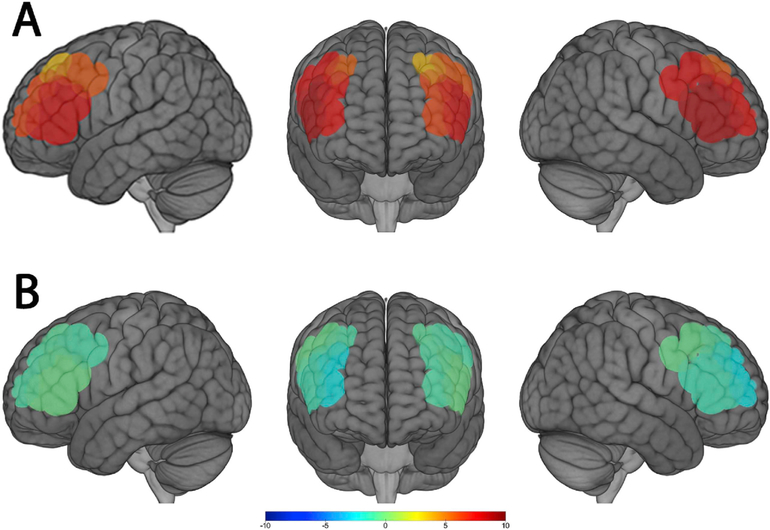
Fig. 2.
Group mean estimates of brain activity across the eight regions of interest (ROIs) in response to the letter-retrieval working memory task (n = 48). Colors represent T-scores with warm colors indicating positive values and cool colors indicating negative values. (A) Brain activation using oxygenated hemoglobin concentrations (HbO). (B) Brain activation using deoxygenated hemoglobin concentrations (HbR).

