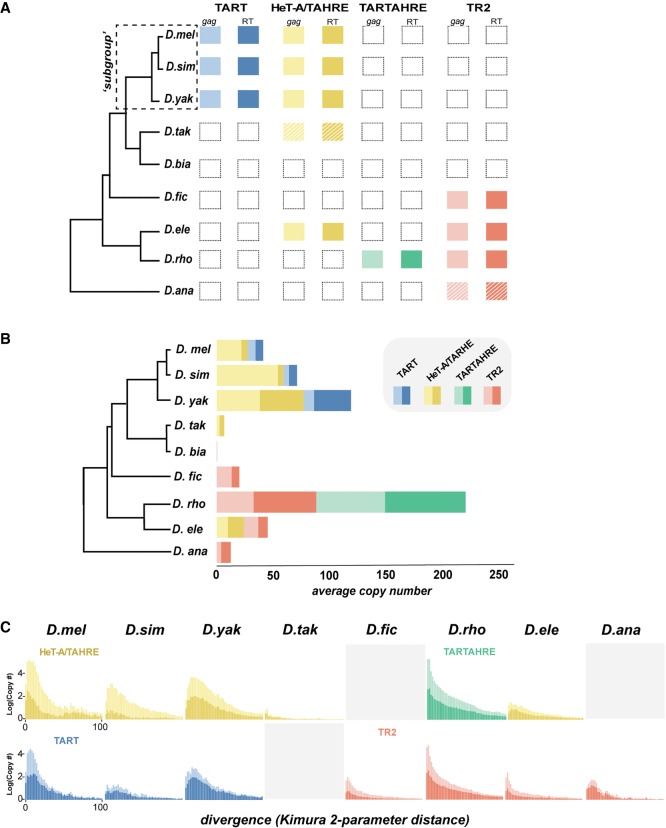
Figure 3.
Telomeric retrotransposon identity, copy number, and history across the melanogaster species group. (A) Presence/absence of telomere-localized elements across the melanogaster species group. Each column represents a phylogenetically distinct lineage defined and validated in Figures 1 and 2, respectively. Hatched lines delineate elements for which only a degraded version was recovered. gag and RT domains are represented by lighter and darker shaded boxes, respectively. (B) Estimated gag (light) and RT (dark) copy number per species calculated from the average read depth of a consensus sequence relative to genome-wide estimates. (C) Repeat landscapes of telomere-specialized retrotransposons captured by Kimura two-parameter distance between genomic reads with significant BLAST hits (>90% identity). Copy number (consensus read no. / genome-wide average read no.) appears on the y-axis, and binned divergence classes appears on the x-axis. The bins closest to zero putatively represent the youngest classes. We estimated divergence for the gag (lighter shade) and RT (darker shade) separately.

