Figure 2.
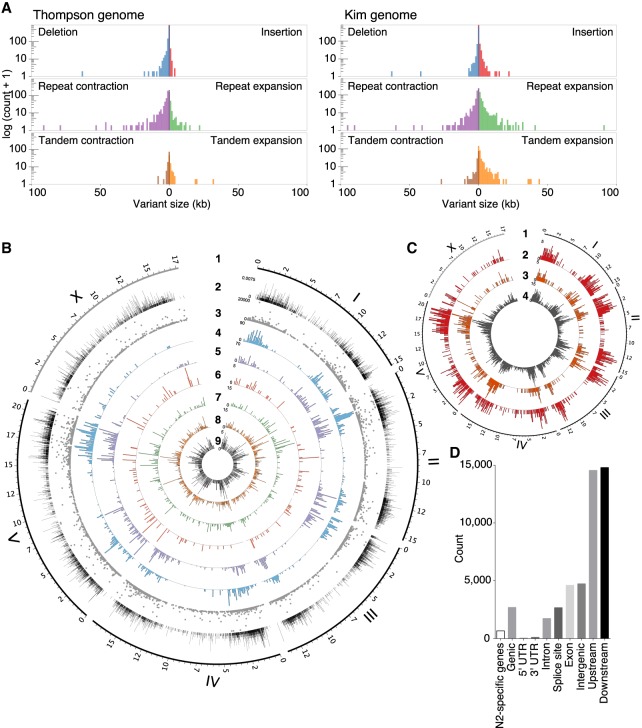
Structural variations (SVs) between the CB4856 and N2 genomes and their effects on chromosomal contents. (A) SVs between the N2 genome and the short-read-based CB4856 genome, previously reported (left), and between the N2 genome and the long read-based CB4856 genome (right). Repeat expansion, tandem expansion, and insertion SVs are more often detected when using long read-based genome than when using the previous short read-based genome. (B) Tracks representing density at 100-kb intervals; from outside to inside: 1, genomic positions (in Mb) of the six chromosomes based on the N2 genome; 2, density of local recombination rate in CB4856/N2 introgression lines; 3–9, types of SVs identified using Assemblytics: 3, size of SVs; 4, density of repeat-contraction SVs; 5, density of repeat-expansion SVs; 6, density of tandem-contraction SVs; 7, density of tandem-expansion SVs; 8, density of deletion SVs; 9, density of insertion SVs. (C) Tracks representing density at 100-kb intervals; from outside to inside: 1, genomic positions (in Mb) of the six chromosomes based on the N2 genome; 2–4, density of SVs estimated by SnpEff: 2, high-impact SVs; 3, low-impact SVs; 4, modifier SVs. (D) Annotation of SVs. SVs effects were categorized using SnpEff based on their position in the annotated N2 genome. “N2-specific genes” indicates the number of the genes that are completely deleted in CB4856. ‘Genic’ indicates the number of genes whose function is predicted to be affected by the SVs. ‘Intergenic’ indicates the number of SVs in the intergenic region. ‘Upstream’ indicates the number of SVs located within 5 kb upstream of a gene. ‘Downstream’ indicates the number of SVs located within 5 kb downstream from a gene.

