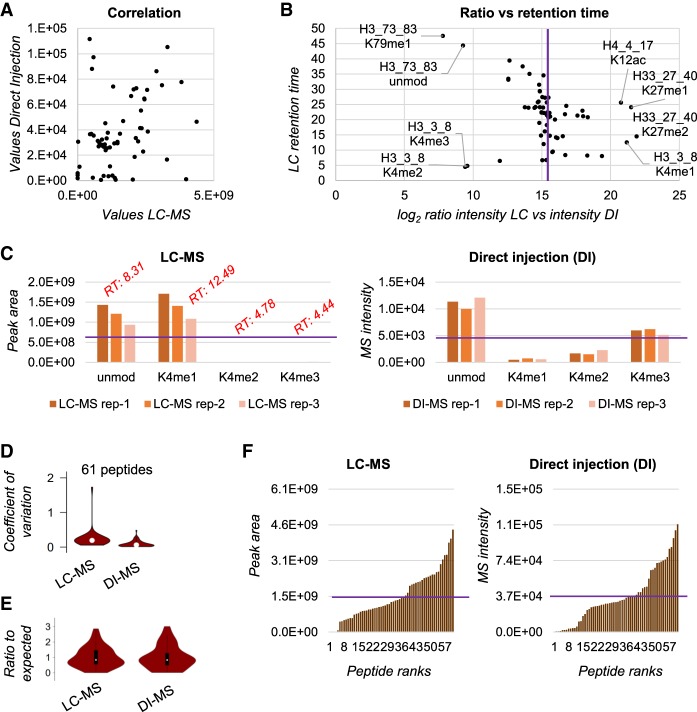
Figure 2.
Detection bias evaluation using a synthetic peptide library. (A) Correlation of the area under the curve extracted for the synthetic peptides by LC-MS (x-axis) and the intensity in the spectrum of the peptides detected by DI-MS (y-axis). The figure is obtained with the average of three technical replicates. (B) Ratio between the area under the curve of the synthetic peptides quantified via LC-MS versus the intensity obtained by DI-MS (x-axis). The y-axis represents the retention time obtained by the LC-MS run. The purple line indicates the expected ratio in case of no bias. (C) Raw abundance of the histone H3 peptide TKQTAR (aa 3–8) obtained by LC-MS (left) and DI-MS (right) for three technical replicates. The purple line represents the theoretical abundance with no bias; the red text indicates the retention time of the LC-MS peaks. (D) Distribution of the coefficient of variation (CV) for three technical replicates for all the 61 synthetic peptides by LC-MS and DI-MS. (E) Ratio between observed abundance and expected abundance for the synthetic peptides. The expected abundance is calculated by averaging all signals as, in theory, they should all provide the same intensity. (F) Distribution of the peptide observed abundance for all 61 peptides by LC-MS (left) and DI-MS (right). Purple line indicates expected intensity.

