Figure 6.
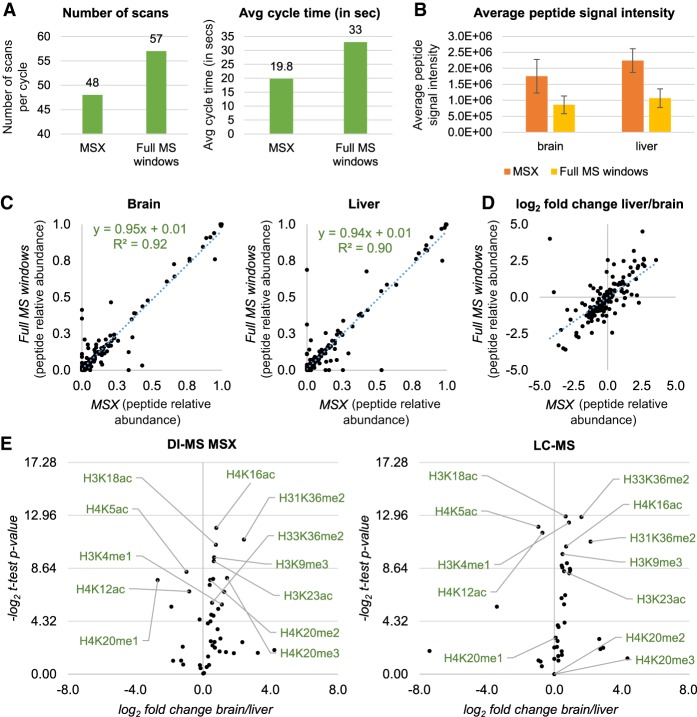
Multiplexed SIM acquisition of endogenous histone peptides. (A) Number of scan events per cycle (left) and average time (right) during DI-MS acquisition using tSIM-MSX versus the canonical DI-MS with windows described in Figure 4A. The instrument allows multiplexing up to 10 ions per scan, so the number of scans can be reduced. (B) Average peptide intensity obtained by running a side-by-side acquisition of endogenous histone peptides extracted from mouse brain and liver using DI-MS and the two different acquisition methods. (C) Relative abundance of histone peptides from brain (left) and liver (right) acquired using MSX (x-axis) or full MS windows (y-axis). (D) Log2 fold change of the histone peptides from the two data sets acquired using MSX (x-axis) or full MS windows (y-axis). (E) Volcano plot showing the total relative abundance of single histone modifications from histone H3 and H4 (estimated by summing the relative abundance of all peptides carrying a given modification) in brain versus liver. Data were acquired using DI-MS with MSX (left) and LC-MS (right). Results show the same PTMs as statistically different in abundance between the two tissues, with the exception of H4K20me2 and H4K20me3, due to inaccurate quantification by LC-MS.

