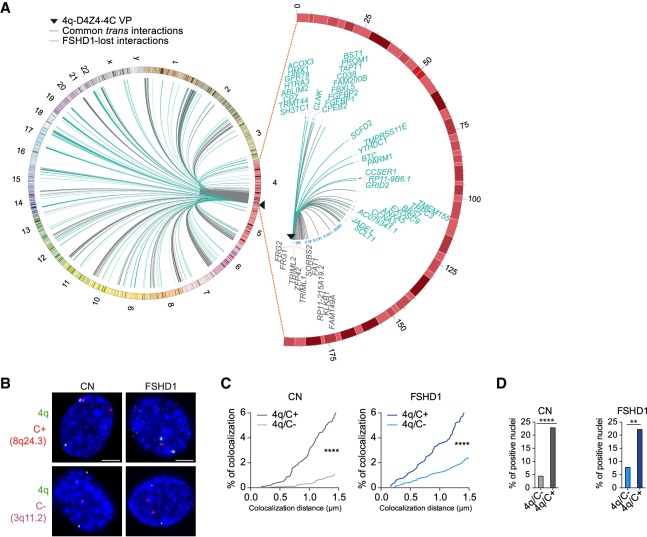
Figure 1.
4q-D4Z4–specific 4C-seq highlights FSHD1 impaired interactome. (A, left) Circos plot (Krzywinski et al. 2009) depicting cis and trans 4q-D4Z4 interactions in CN (CN-3, CN-4) myoblasts (MBs) called by 4C-ker. Common interactions with FSHD1 (FSHD1-3, FSHD1-4) MBs are in gray, whereas interactions specifically lost in FSHD1 are highlighted in light blue. (Right) Zoomed-in Circos plot representation of common (gray) and FSHD1 lost (light blue) cis interactions on Chr 4. Genes are indicated for a region extending up to 4 Mb from the VP. Black triangles in Circos plots depict the VP localization. (B) Representative nuclei of 3D multicolor DNA FISH using probes mapping to 4q35.1 region (4q; green), a 4q-D4Z4–positive interacting region (8q24.3, C+; red), and a 4q-D4Z4 not interacting region (3q11.2, C−; magenta) in CN (CN-1, CN-2, CN-3, CN-4) and FSHD1 (FSHD1-1, FSHD1-2, FSHD1-3, FSHD1-4) MBs. Nuclei are counterstained with DAPI (blue). All images at 63× magnification. Scale bar, 5 µm. (C) Cumulative frequency distributions of distances (below 1.5 µm) between 4q and C+ and between 4q and C− in CN (dark and light gray; left) and FSHD1 (dark and light blue; right) MBs. n = 1296 (CN 4q/C+), 1708 (CN 4q/C−), 884 (FSHD1 4q/C+), and 1128 (FSHD1 4q/C−). P-values were calculated by unpaired one-tailed t-test with a confidence interval of 99%. Asterisks represent statistical P-values: for 4q/C+ versus 4q/C− in CN and FSHD1, P < 0.0001. (D) Percentage of nuclei positive for the interactions (under the cutoff of 1.5 µm). n = 427 (CN 4q/C−), 324 (CN 4q/C+), 282 (FSHD1 4q/C−), and 221 (FSHD1 4q/C+). P-values were calculated by Fisher's exact one-sided test with a confidence interval of 99%. Asterisks represent statistical P-values: for 4q/C− versus 4q/C+ in CN, P < 0.0001; for 4q/C− versus 4q/C+ in FSHD1, P = 0.0046.

