Figure 3.
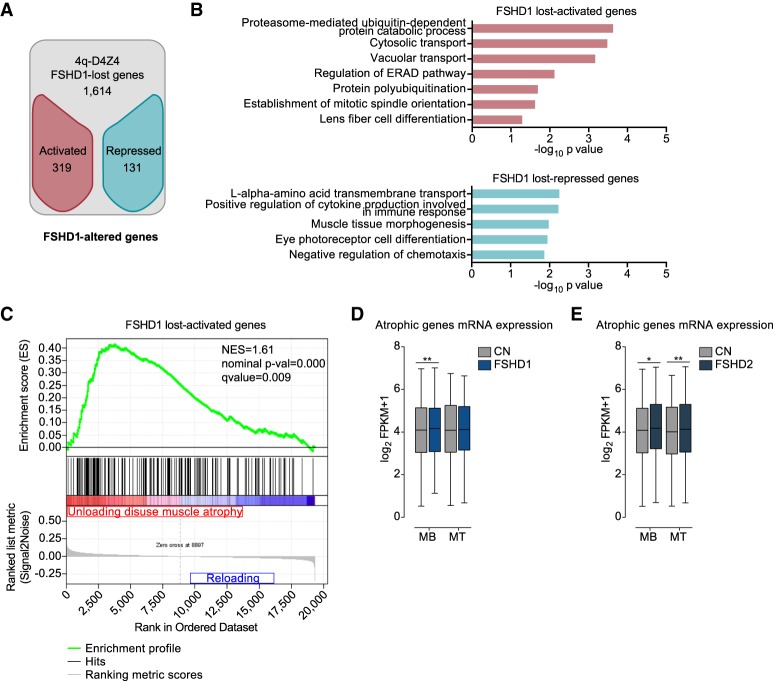
Genes that have lost the interaction with 4q-D4Z4 have a more active chromatin state and are enriched for muscle atrophy signature in FSHD muscle cells. (A) Flowchart of filtering steps to identify FSHD1-altered genes. Genes within lost 4q-D4Z4 interactions were filtered as activated (red) or repressed (blue) in FSHD1. (B) Gene Ontology analysis (Biological Processes) of FSHD1 lost-activated and lost-repressed genes. Bars correspond to −log10 of the P-value. (C) Gene set enrichment analysis (GSEA) results of the 319 FSHD1 lost-activated genes performed on expression data from unloading-induced muscle atrophy subjects (Reich et al. 2010). Genes up-regulated in atrophic condition are depicted in red, whereas genes not enriched are depicted in blue. (NES) normalized enrichment score. (D) Expression levels from RNA-seq data sets for atrophic genes (Reich et al. 2010) in CN (CN-3, CN-4, and Yao's data sets C20, C21, C22) and FSHD1 (FSHD1-3, FSHD1-4, and Yao's data sets F4, F6) (Yao et al. 2014) MBs and MTs. Box-and-whisker plots show the median of matched expression values of each gene for CN and FSHD1, and whiskers extend to the 5 to 95 percentiles. P-values were calculated by paired two-tailed t-test with a confidence interval of 99%. Asterisks represent statistical P-values: for CN versus FSHD1 in MBs, P = 0.0099. (E) Expression levels from RNA-seq data sets for atrophic genes (Reich et al. 2010) in CN (CN-3, CN-4, and Yao's data sets C20, C21, C22) and FSHD2 (Yao's data sets F12, F14, F20) (Yao et al. 2014) MBs and MTs. Box-and-whisker plots show the median of matched expression values of each gene for CN and FSHD2, and whiskers extend to the 5 to 95 percentiles. P-values were calculated by paired two-tailed t-test with a confidence interval of 99%. Asterisks represent statistical P-values: for CN versus FSHD2 in MBs, P = 0.0251; for CN versus FSHD2 in MTs, P = 0.0041.

