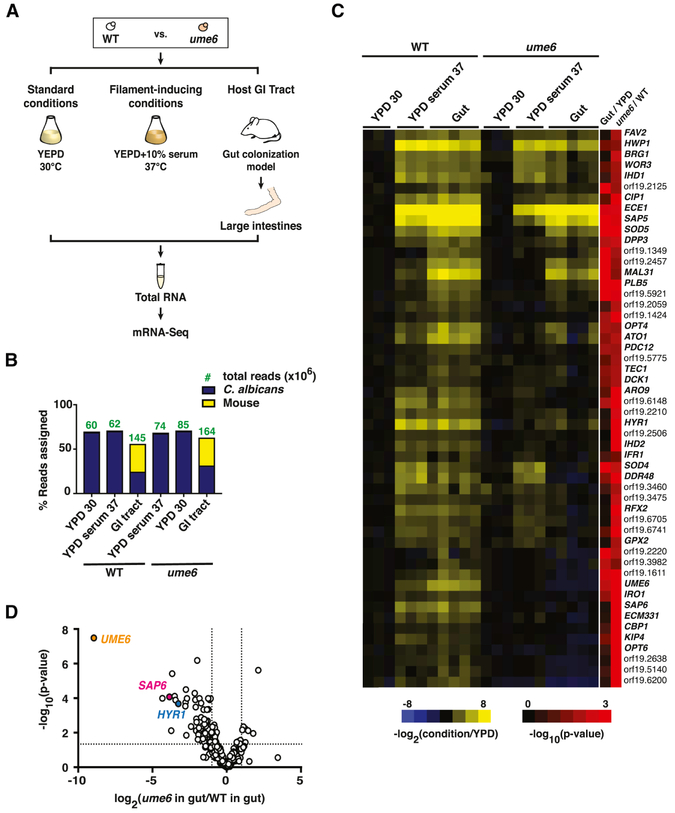
Figure 5. mRNA-Seq reveals Ume6 regulation of a subset of hypha-associated genes in the gut.
A) Schematic of mRNA-Seq experiment. PolyA RNA was recovered from WT C. albicans (ySN250) and ume6 (ySN1479) propagated under standard in vitro conditions (YPD, 30°C; n=3 cultures), filament-inducing conditions (YPD+10% serum, 37°C; n=3 cultures), or for 10 days in the GI commensalism model (n=5 animals). B) Analysis of sequencing depth and coverage. Bars represent % reads that align to C. albicans vs. mouse transcriptomes. Green numbers denote the read count (in millions) of indicated strains under each condition. C) Heat map of hypha-associated gene expression under laboratory conditions and in the host digestive tract. Values represent the log2 function of the tpm under the indicated condition divided by the tpm under standard in vitro conditions (YPD, 30°C). Final two columns represent the significance [−log10(adjusted p-value)] of expression differences between wild type propagated in the gut vs. in vitro (Gut/YPD) and ume6 vs. WT when both are propagated in the gut (ume6/WT). D) Volcano plot depicting the log2 transformed ratio of hypha-associated gene expression in commensally propagated ume6 vs. wild type (x-axis) versus significance (y-axis). Full mRNA-Seq datasets are presented in Table S4.

