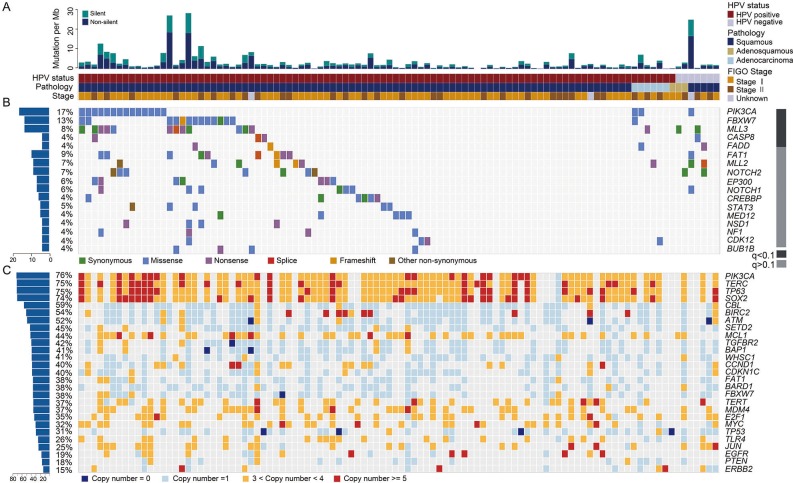
Figure 1.
Genomic alteration profiles of cervical carcinomas. (A) Total mutational rates per Mb, including the non-silent and silent mutations in each sample. The HPV infection status, pathology type and International Federation of Gynecology and Obstetrics (FIGO) stage for all the cases are displayed below. (B) The alteration spectrum of the significantly mutated genes in 102 cervical cancers (CCs). The grey bar on the right indicates the q value calculated using MutsigCV. The frequency of non-silent mutations in each gene is shown on the left. (C) A summary of the significantly amplified or deleted genes in 102 CCs, with the frequency of each gene shown on the left.

