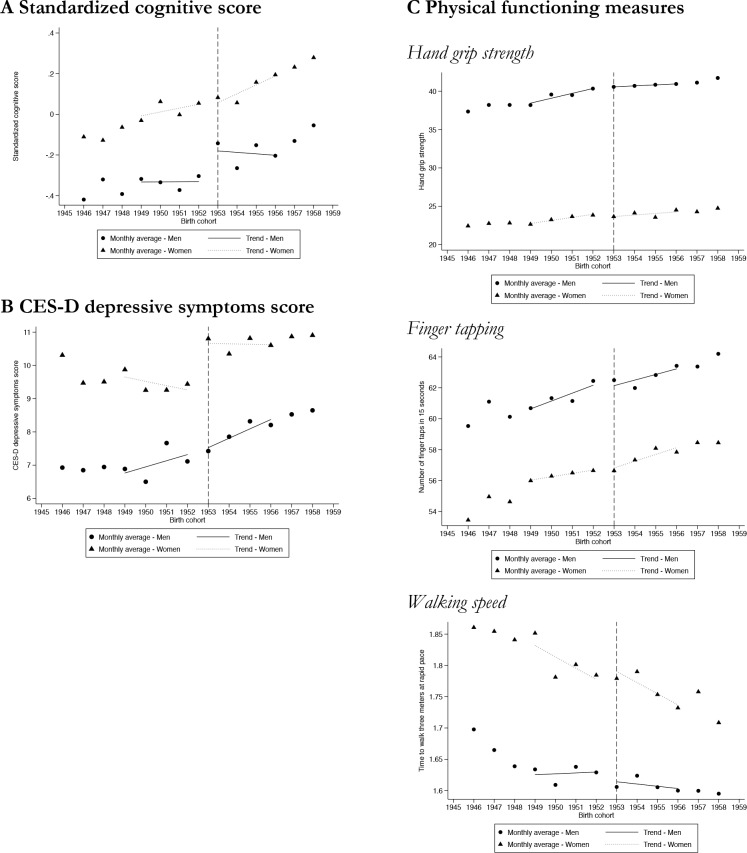
Figure 2.
Effect of eligibility to the 1959 Berthoin reform on health outcomes by gender in the 2012 Constances Study (n=33 762), Birth Cohorts 1946–1959. The dots and triangles show the average school leaving age, respectively, for men and women and for each birth cohort. The dashed line represents the cut-off for eligibility to the reform (1 January 1953). The fitted lines represent the linear trends for our analytical sample: respondents born up to 48 months before or after the reform, separately for men (black lines) and women (dotted lines). CES-D, Center for Epidemiologic Studies Depressive Symptoms Scale.

