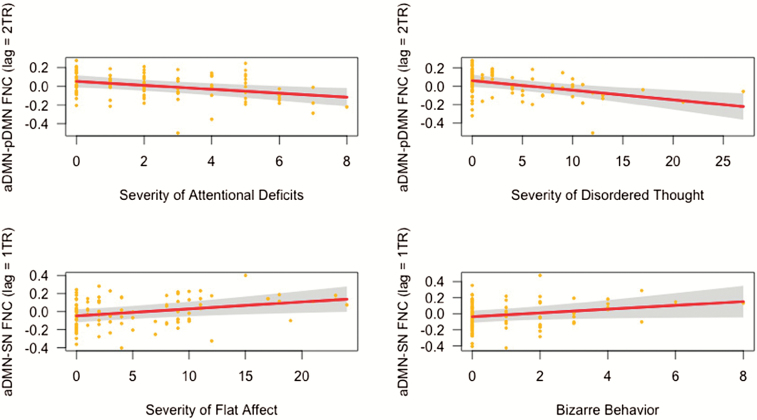
Fig. 2.
Associations between symptom severity and time-lag-shifted functional network connectivity (FNC). Partial regression plots showing negative associations between lagged (2 TR) aDMN→pDMN connectivity and reported severity of attentional deficits (top left) and thought disorder (top right), in addition to positive associations between lagged (1 TR) aDMN→SN connectivity and severity of flat affect (bottom left) and bizarre behavior (bottom right). Covariates controlled for in the linear model included age, gender, scanning site, and mean framewise displacement. aDMN, anterior default mode network; pDMN, posterior default mode network; SN, salience network.

