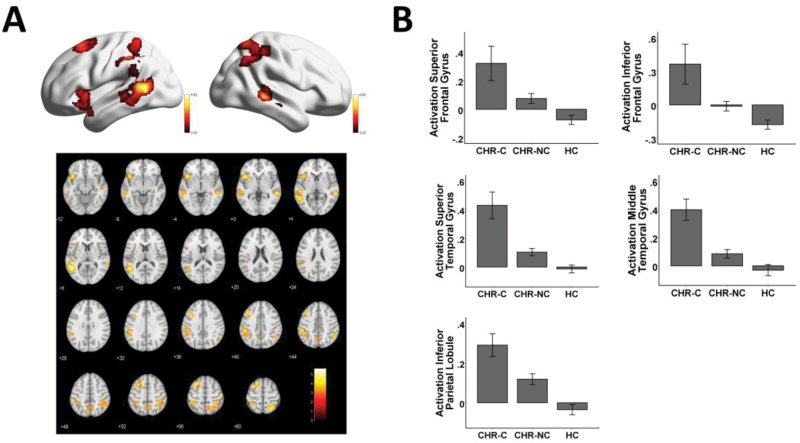
Fig. 1.
Between-group activation differences during memory retrieval at baseline scan (panel A). Subjects at CHR showed significantly higher activation in the prefrontal, parietal and temporal cortices compared with controls, with hyperactivation more prominent in converters than nonconverters. For presentation purposes, the activation maps are thresholded at P < .001 with cluster size of more than 300 voxels. The mean first eigenvariates across all voxels in each region are plotted in panel B, with error bars indicating the standard error. CHR, clinical high risk; CHR-C, clinical high risk-converters; CHR-NC, clinical high risk-nonconverters; HC, healthy control.

