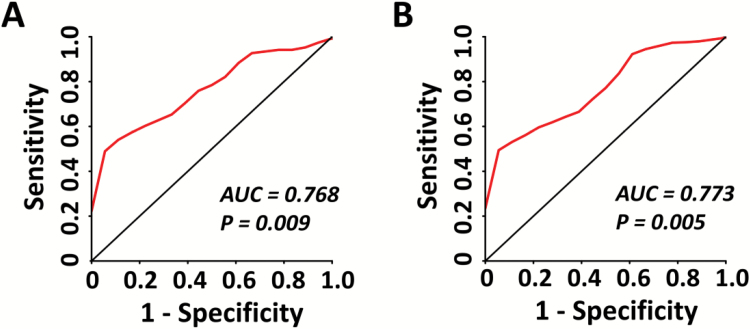
Fig. 4.
The multivariate receiver operating characteristic curves for baseline activation measures showed an area under curve (AUC) of 0.768 for distinguishing converters from nonconverters among subjects at clinical high risk (panel A), and an AUC of 0.773 for distinguishing converters from both nonconverters and controls (panel B). For both curves, the AUCs were highly significant from 10 000 permutations, indicating better prediction accuracy than chance.

