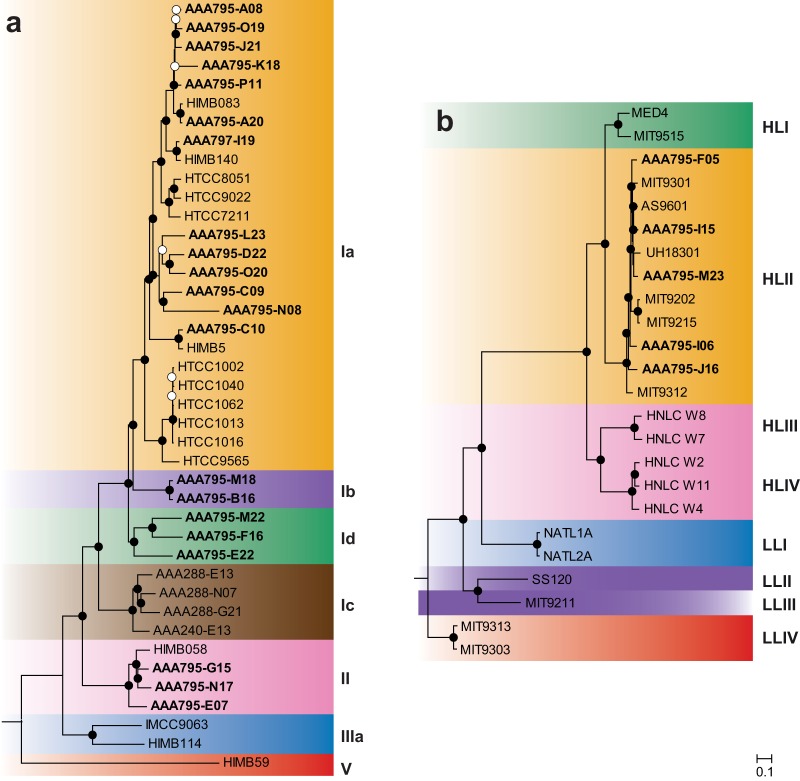
FIG 1.
Maximum-likelihood proteomic trees for single-cell genomes from this study (boldface), plus a representative set of cultured genomes. Trees were built from concatenated alignments of 89 SAR11 (a) and 96 Prochlorococcus (b) single-copy orthologous genes. Bootstrap values are indicated at the nodes (solid circles, ≥80%; open circles, ≥50%). Scale bar equals 0.1 changes per site. The Red Sea SAR11 SAGs cluster with subclades Ia, Ib, Id, and II. The Red Sea Prochlorococcus SAGs all cluster with ecotype HLII.

