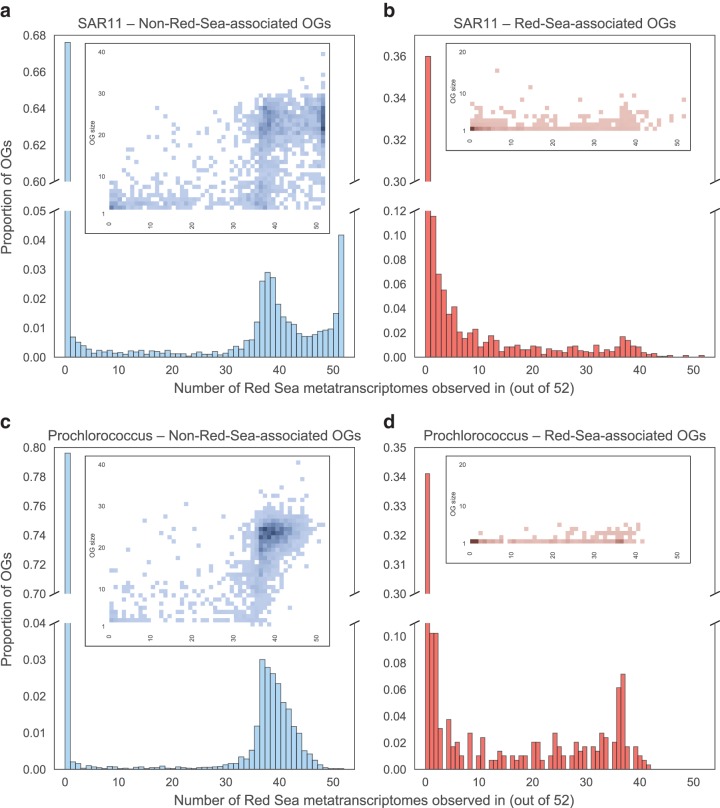
FIG 3.
Expression of SAG OGs in Red Sea metatranscriptomes. The 52 metatranscriptomes span a broad range of the water column at a station in the central Red Sea: four depths and 13 time points over a 48-h period (every 4 h). Histograms show the number of metatranscriptomes found in SAR11 non-RS-OGs (a), SAR11 RS-OGs (b), Prochlorococcus non-RS-OGs (c), and Prochlorococcus RS-OGs (d). Heatmaps (inset) show the density of OGs based on OG size (number of total copies across the SAGs) and the number of metatranscriptomes an OG is found in. RS-OGs were more likely than other OGs to be expressed in one or more samples, and non-RS-OGs that were expressed were more likely to be expressed in a large number of samples.

