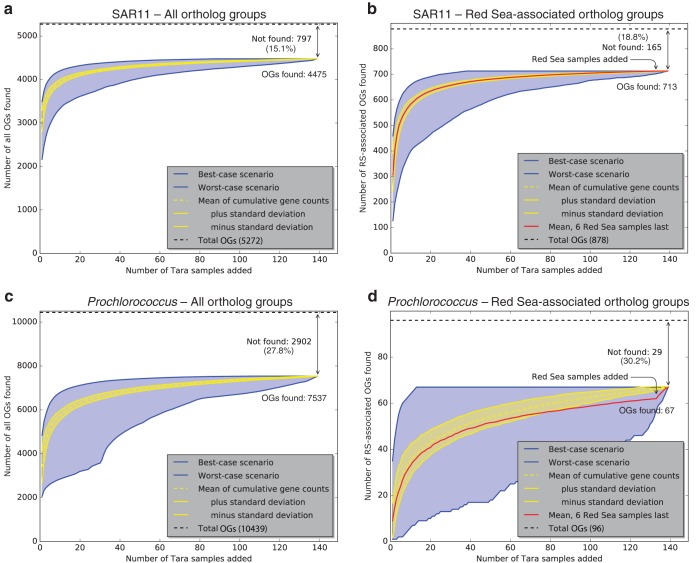
FIG 4.
Rarefaction analysis showing the proportion of all OGs (a and c) and RS-OGs of SAR11 (b and d) and Prochlorococcus observed in Tara Oceans metagenome samples. Curves show the cumulative number of OGs observed in Tara Oceans samples (E value of <1e−5) as more samples are added. Yellow lines show the averages ± standard deviations from 1,000 permutations of randomly added samples. Blue lines show the best-case scenario (each sample added is that with the most number of new OGs observed) and worst-case scenario (each sample added is that with the fewest number of new OGs observed). Red lines show the means from 1,000 permutations of randomly added samples but with Red Sea samples (031_SRF_0.22-1.6, 032_DCM_0.22-1.6, 032_SRF_0.22-1.6, 033_SRF_0.22-1.6, 034_DCM_0.22-1.6, and 034_SRF_0.22-1.6) added last. As more Tara metagenome samples are added to the analysis, the number of new OGs identified approaches a plateau where new samples do not reveal many new OGs. The same is true with RS-OGs, even when samples from the Red Sea are added last, with the exception of 5 Prochlorococcus OGs (proch20367, proch20368, proch20390, proch20423, and proch20438).

