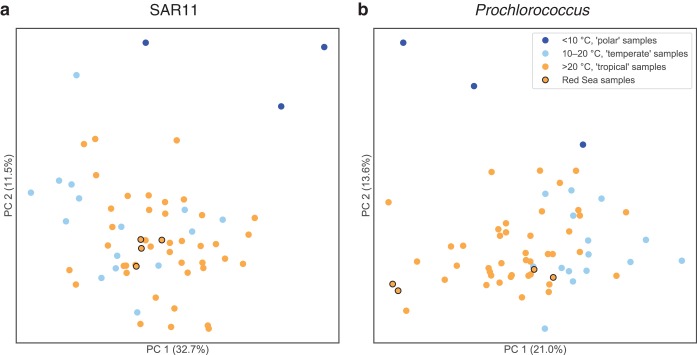
FIG 5.
Principal component analysis of Tara Oceans surface samples by the abundance of SAR11 (a) and Prochlorococcus (b) OGs. The ordination shows the similarity of Tara Oceans samples to each other along the first two principal components. Samples are colored by Tara temperature categories: polar samples (<10°C) are dark blue, temperate samples (10 to 20°C) are light blue, tropical samples (>20°C) are orange, and Red Sea tropical samples are orange with black edges. Red Sea samples and Tara samples generally show more separation based on temperature when ordinated by Prochlorococcus OG composition than by SAR11 OG composition.

