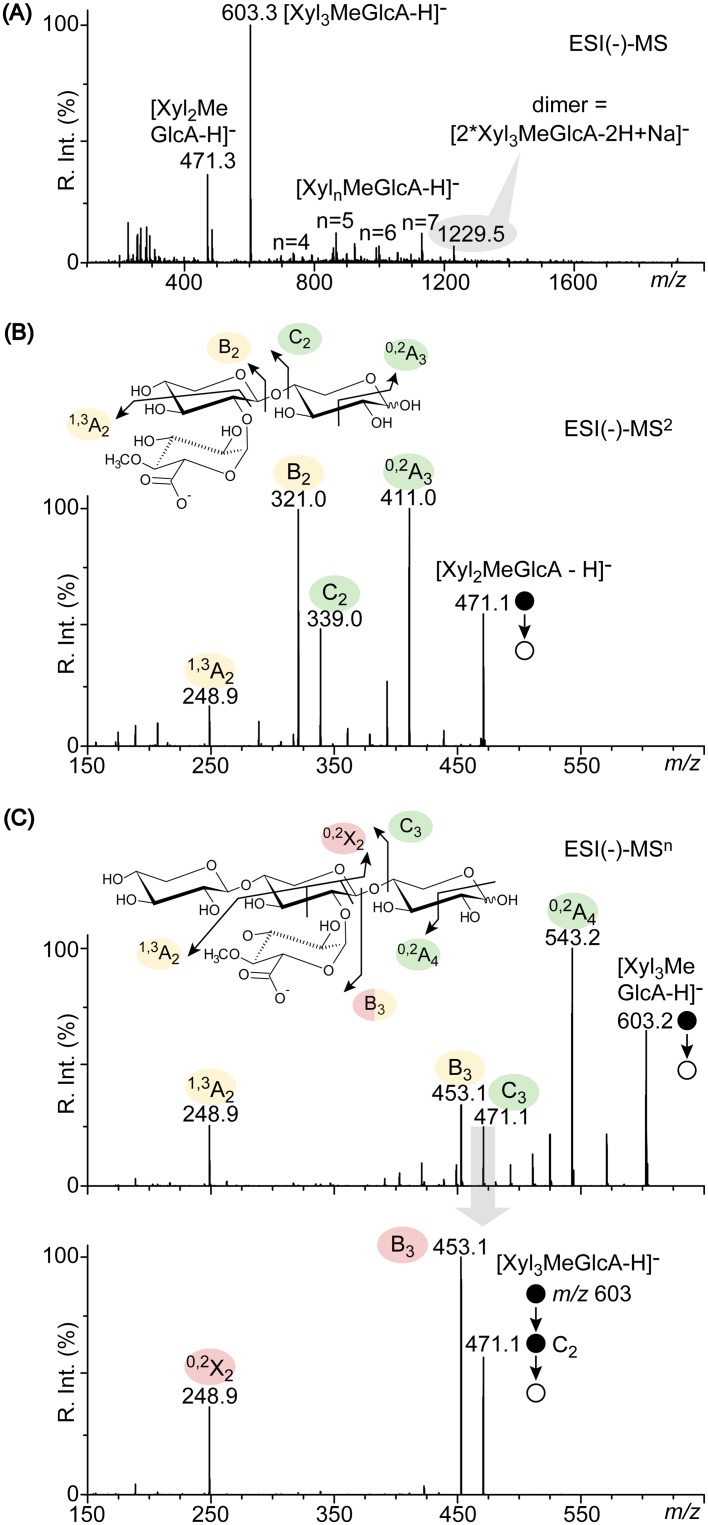
FIG 6.
Structural analysis of hydrolysis products obtained from beechwood glucuronoxylan. (A) ESI(−)-MS spectra of acidic XOSs produced by Xyn30A. (B) ESI(−)-MS2 spectra of the shortest Xyl2MeGlcA. (C) ESI(−)-MSn spectra of the major Xyl3MeGlcA. Structures of XOSs are depicted in insets using pairs of diagnostic product ions proposed previously (6).

