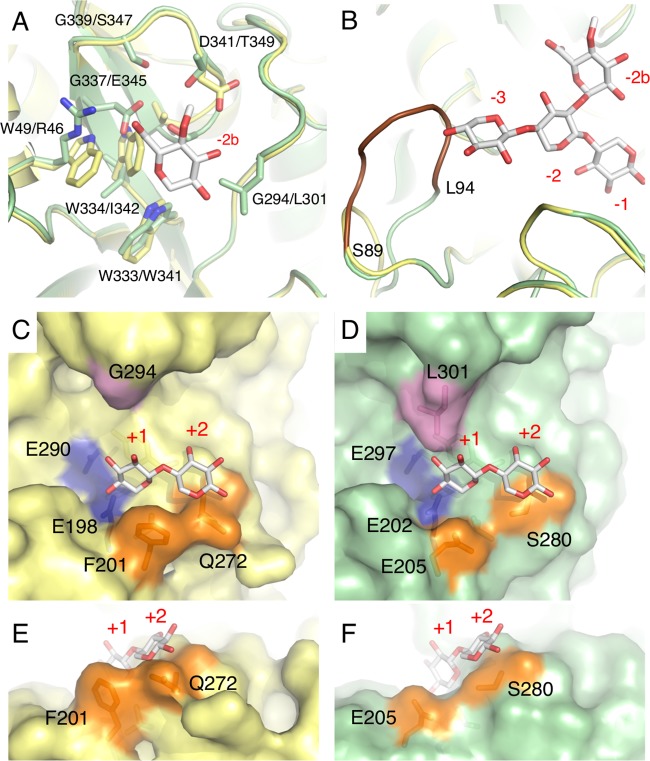
FIG 8.
3D structural analysis of Xyn30A. The Xyn30A homology model is compared with the crystal structure of Xyn30B (PDB no. 6IUJ) (20). The superimposed model structures of Xyn30A and Xyn30B, with MeGlcA2Xyl3 at negative subsites (A and B) and Xyl2 at positive subsites (C to F), are based on the crystal structure of EcXynA complexed with MeGlcA2Xyl3 (PDB no. 2Y24) and Clostridium thermocellum Xyn30A (CtXyn30A) complexed with xylobiose (PDB no. 5A6M), respectively. Atoms are depicted as follows: C in Xyn30A (yellow) and C in Xyn30B (green), C in ligands (white), O (red), and N (blue). (A) MeGlcA and amino acid residues in subsite −2b of Xyn30A and Xyn30B are shown in order of Xyn30A/Xyn30B. (B) The β2-α2 loops of Xyn30A and Xyn30B containing MeGlcA2Xyl3 are depicted at subsites −3 to −1. The extended loop of Xyn30B (amino acid residues are shown as blue characters in Fig. 2) is depicted in brown. (C and D) Structures of positive subsites in Xyn30A (C) and Xyn30B (D) with xylobiose at the +1 and +2 subsites. Two catalytic Glu residues, Phe-201 and Gln-272, and Gly-294 of Xyn30A are shown in blue, orange, and purple, respectively; the equivalent residues of Xyn30B are shown using the same colors. (E and F) Different view of positive subsites in Xyn30A (E) and Xyn30B (F).

