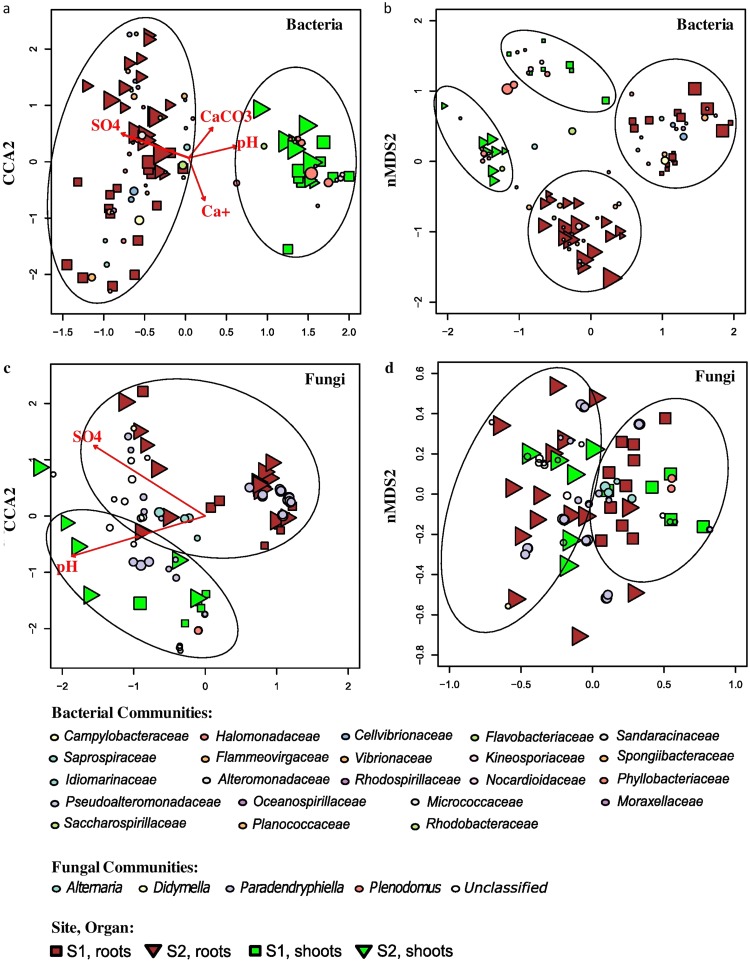
FIG 2.
Analysis of log-transformed and Wisconsin double-standardized Bray-Curtis dissimilarity matrix for endophytic bacterial and fungal communities associated with S. europaea, respectively. (a and c) CCA (canonical correspondence analysis); (b and d) NMDS (nonmetric multidimensional scaling analysis). Circles represent OTUs; their fill color denotes consensus taxonomy at the family level (bacteria) and genus level (fungi). The size reflects abundance. Squares, S1 samples; triangles, S2 samples; green, shoots; brown, roots. Arrows in the CCA graphs denote soil parameters that were significantly associated with the community structure.

