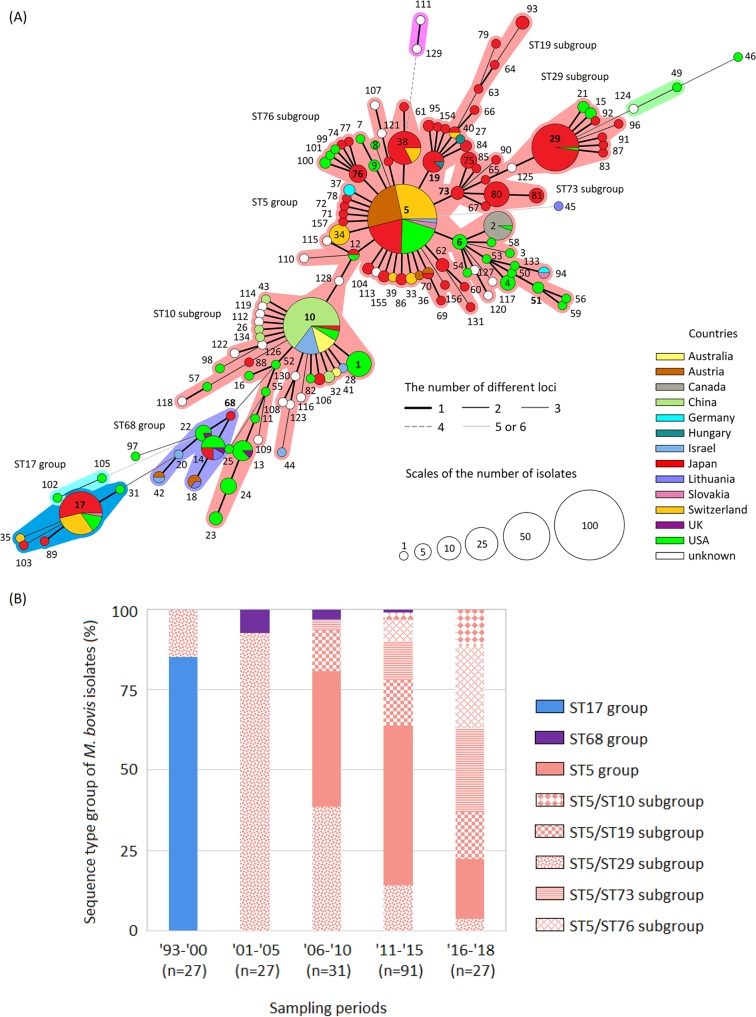
FIG 1.
(A) Minimum spanning tree representing the evolutionary relationship between M. bovis sequence types (STs) by multilocus sequencetyping. Numbers indicate STs, and the central ST and subcentral STs of each ST group are indicated in bold. A group of STs in which two or fewer loci differ from each other is considered an ST group and is surrounded by a specific color. The size of the circles represents the population size, and the circular chart in each circle indicates the proportion of countries of origin in each ST. The thickness and dotting of the lines indicate the number of different loci between the STs; a thicker line denotes a closer distance than a thin line, and a thin line denotes a closer distance than a dotted line. Among the whole-genome-analyzed strains, strain PG45T was identified as a member of ST17, and all strains from China were members of the ST10 subgroup (Hubei-1, 08M, CQ-W70, HB0801, NM2012, and Ningxia-1). (B) Chronological change of genotypes by MLST of M. bovis isolates in Japan. Numbers on the x axis represent years, with the last two digits shown for each year.

