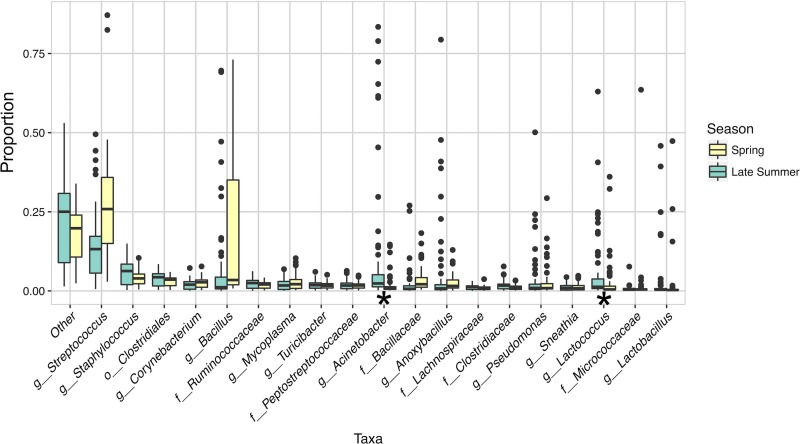
FIG 2.
Bacteria present in milk during processing. Box plots of taxa detected at >0.01 average relative abundance during milk storage, pasteurization, concentration, and separation processing steps are shown for two sampling dates in 2014 (“Spring” indicates sampling performed on 1 and 2 April 2014 and “Late Summer” indicates 29 and 30 September 2014). These samples were not PMA treated prior to analysis. Milk microbiota from concentration step 3 were not included here because they were not tested in the spring. Proportions were estimated from an OTU table rarefied at 9,000 sequences per sample. The “Other” category represents taxa that were present at <0.01 mean relative abundance in the data set. LefSe analysis was performed with season as class and equipment type as subclass. Boxes define the interquartile range of taxonomic abundance and the individual points are outliers. Significant differences in taxa between seasons are indicated by an asterisk. Taxonomic levels are abbreviated in the x axis according to the following: “o” = order, “f” = family, and “g” = genus.

