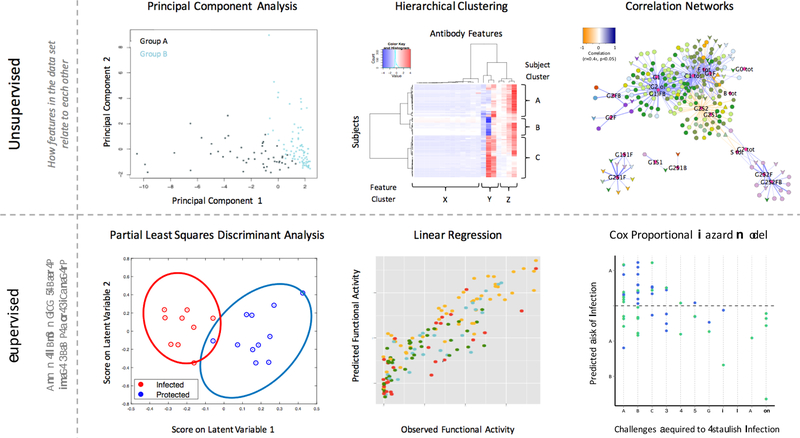
Figure 2. Examples of humoral immune response analysis supported by machine learning.
Unsupervised methods (top) including principal component analysis (left), hierarchical clustering (center), and correlation networks (right) depict the main aspects of variation in, magnitudes of, and underlying relationships between humoral response features and subjects. Supervised methods (bottom) model how data can be used to predict parameters of interest, such as group (left), antibody activity (center), or challenge outcome (right).

