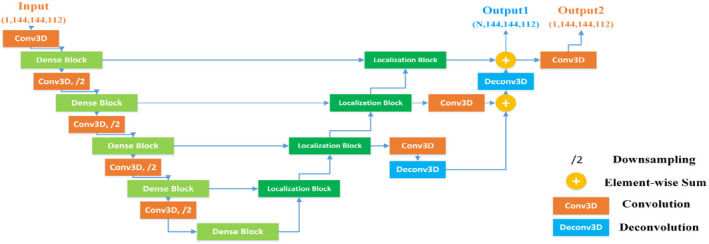
Figure 3.

The architecture of the segmentation network. N represents the number of organs to be segmented. For concise illustration, batch normalization and rectified linear unit are omitted from this figure. [Color figure can be viewed at wileyonlinelibrary.com]
