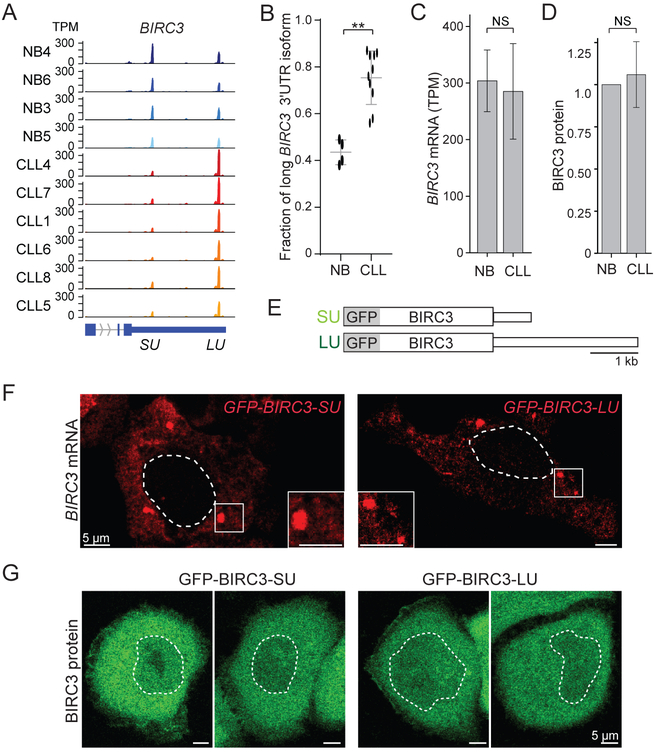
Figure 1. The alternative BIRC3 3′UTRs do not regulate BIRC3 protein abundance or localization.
(A) The short and long BIRC3 3′UTRs are shown as 3′-seq data in transcripts per million (TPM) for normal CD5+ B cells (NB) and CLL B cells. The terminal exons are shown in blue. SU, short 3′UTR, LU, long 3′UTR.
(B) Fraction of long BIRC3 3′UTR isoform in normal (N = 4) and CLL B (N = 10) cells as mean ± SD, Mann Whitney test, **, p = 0.003.
(C) Overall BIRC3 mRNA abundance of samples from (B). Mann Whitney test, p = NS (not significant).
(D) BIRC3 protein level quantification from Figure S1D. Mann Whitney test, p = NS.
(E) Constructs: GFP fusion with BIRC3 coding region, followed by either the short (SU) or long (LU) BIRC3 3′UTR.
(F) Single molecule RNA-FISH against GFP after transfection of constructs from (E) in HeLa cells. The dotted line demarcates the nucleus. Representative cells are presented.
(G) Live cell fluorescence microscopy shows GFP-BIRC3 protein as in (F).

