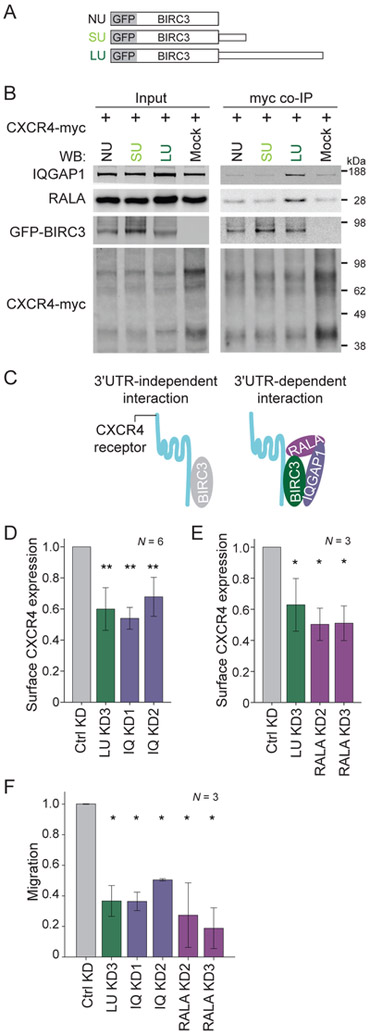
Figure 6. IQGAP1 and RALA are recruited to CXCR4 in a BIRC3-LU-dependent manner and regulate surface CXCR4 expression and B cell migration.
(A) Constructs as in Figure 1E and GFP fusion with BIRC3 coding region, followed by no 3′UTR (NU; but the construct includes a polyadenylation signal).
(B) Myc co-IP of endogenous IQGAP1 and RALA after transfection of CXCR4-myc and the constructs from (A) into HEK293T cells. 4.5 % of input was loaded. Quantification in Figure S6A.
(C) Model of 3′UTR-independent interaction between BIRC3 and CXCR4, which can be accomplished by BIRC3-NU, BIRC3-SU or BIRC3-LU. The 3′UTR-dependent interaction happens between BIRC3-LU, IQGAP1, RALA, and CXCR4 and can only be accomplished by BIRC3-LU.
(D) FACS analysis of endogenous surface CXCR4 levels in Raji cells stably expressing a ctrl shRNA or shRNAs against IQGAP1 (IQ KD). LU KD is shown for comparison reasons. MFI ± SD from biological replicates. Mann Whitney test, ctrl KD vs each sample, **, p = 0.002. Representative example in Figure S6D.
(E) As in (D), but cells with stable expression of shRNAs against RALA (RALA KD). Mean MFI ± SD from biological replicates. Mann Whitney test, ctrl KD vs each sample, *, p = 0.037. Representative example in Figure S6E.
(F) B cell migration as in Figure 2C. Kruskal Wallis test, p = 0.009. Mann Whitney test, ctrl KD vs each sample, *, p = 0.05.

