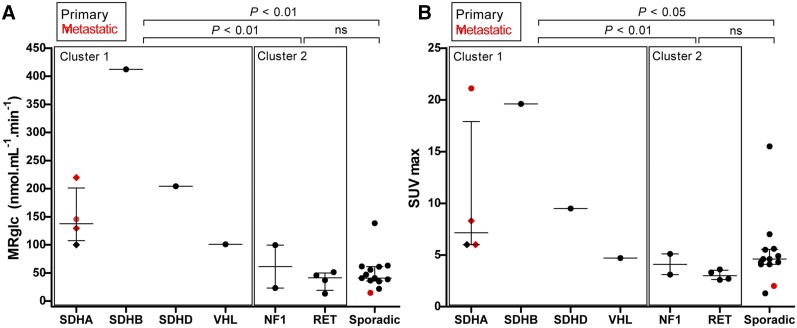
FIGURE 3.
Scatterplots showing MRglc (A) and 18F-FDG SUVmax (B) in PPGLs across different genotypes. Horizontal bar represents median and interquartile range. Diamonds represent 3 different tumor locations in same patient (patient 7, Table 1). All SUVs are normalized for body weight and decay. P values are from Kruskal–Wallis with Dunn post hoc testing, and groups are compared as indicated. ns = not significant.

