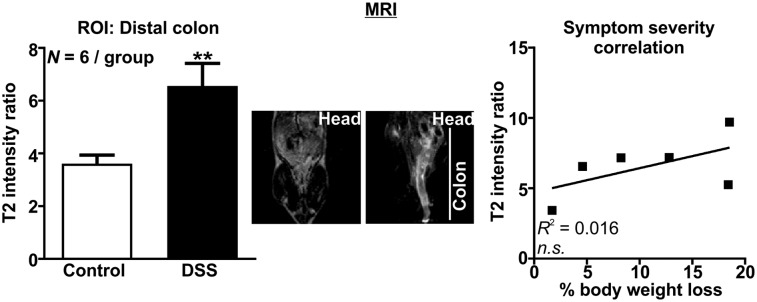
FIGURE 5.
MRI detection of colonic inflammation. Region-of-interest analysis with representative MR image (coronal) of control and DSS mice (left) and correlation of percentage body weight loss with region-of-interest MRI analysis (right). **P < 0.01. n.s. = not statistically significant; ROI = region of interest.

