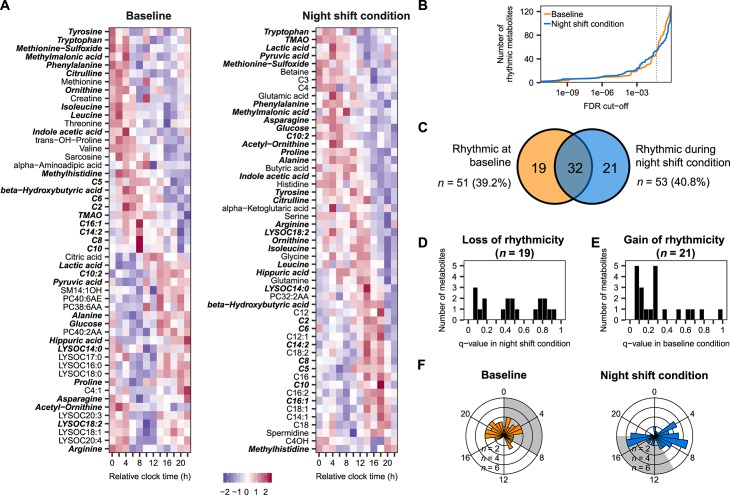
Fig 1. Identification of metabolite rhythms at baseline and during the night shift condition.
(A) Heatmap of metabolites identified as rhythmic by mixed-effects cosinor analysis (FDR < 0.05) at baseline (left) and during the night shift condition (right). Metabolites that are rhythmic in both conditions are shown in bold-italic. (B) Number of rhythmic metabolites across the continuum of FDR cutoffs. Dotted vertical line represents an FDR cutoff of 0.05. (C) Venn diagram depicting the number of metabolites identified as significantly rhythmic at baseline, during the night shift condition, and the overlap. (D, E) Histogram displaying the distribution of q-values obtained by mixed-effects cosinor analysis on (D) the 19 metabolites that were rhythmic at baseline but not during the night shift condition and (E) the 21 metabolites that were rhythmic during the night shift condition but not at baseline. (F) Phase distribution of metabolites identified as rhythmic at baseline (left) and during circadian misalignment (right). Shaded areas represent the scheduled sleep periods in the two conditions. Numerical data underlying the results presented in this figure are available in S2 Data. FDR, false discovery rate; TMAO, trimethylamine N-oxide.

