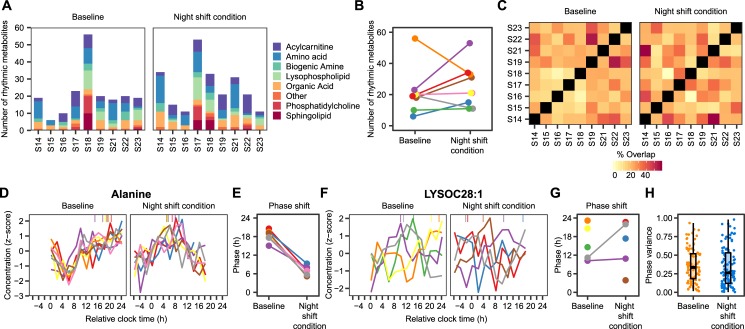
Fig 3. Individual variability in metabolite rhythms.
(A) Number of significantly rhythmic metabolites (corrected p < 0.05, individual cosinor analysis) per metabolite class and per subject at baseline (left panel) and in the night shift condition (right panel). (B) Change in number of rhythmic metabolites at baseline and during the night shift condition. Different lines and colours represent different subjects. (C) Percentage of rhythmic metabolites that overlap between each pair of subjects. (D, F) Rhythmic alanine (D) and LysoC28:1 (F) profiles per subject at baseline and the night shift condition. Symbols on top of each panel indicate the phase of the rhythm. Different colours represent different subjects. Only rhythmic profiles (uncorrected p < 0.05) are shown. (E, G) Initial and final phases of alanine (E) and LysoC28:1 (G) profiles per subject. Colours, representing different subjects, matched with the colours in B, D, and F. (H) Circular variance of individual phase estimates per metabolite at baseline and during the night shift condition. Circular variance ranges from 0 to 1, with lower values indicating tighter clustering of the phase estimates around the mean and higher values indicating a higher degree of dispersion around the 24-h cycle. Only metabolites that were rhythmic (uncorrected p-value <0.05) in at least 3 subjects were taken into account. Numerical data underlying the results presented in this figure are available in S2 Data. LysoC, lysophospholipid.

