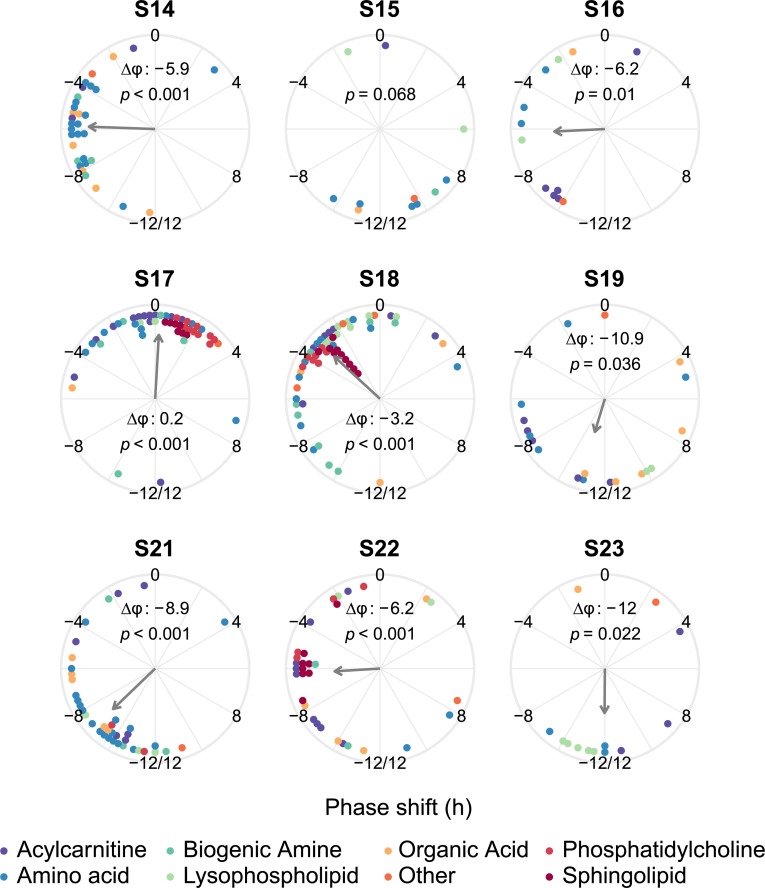
Fig 4. Phase shifts of rhythmic metabolites per subject.
Panels show the data for each of the 9 subjects. Dots represent the phase shifts of metabolites that are rhythmic (uncorrected p < 0.05) both at baseline and during the night shift schedule in that subject. By convention, a negative phase shift denotes a phase delay; a positive phase shift denotes a phase advance. The p-value for the significance of the mean direction of the phase shift (Rayleigh test) is shown in each panel, as well as the average phase shift (Δφ) if the Rayleigh test p-value is <0.05. Arrow length represents the resultant vector length, an indication of the strength of the mean direction. The colour of the dots represents the metabolite class, as indicated in the legend. Numerical data underlying the results presented in this figure are available in S2 Data.

