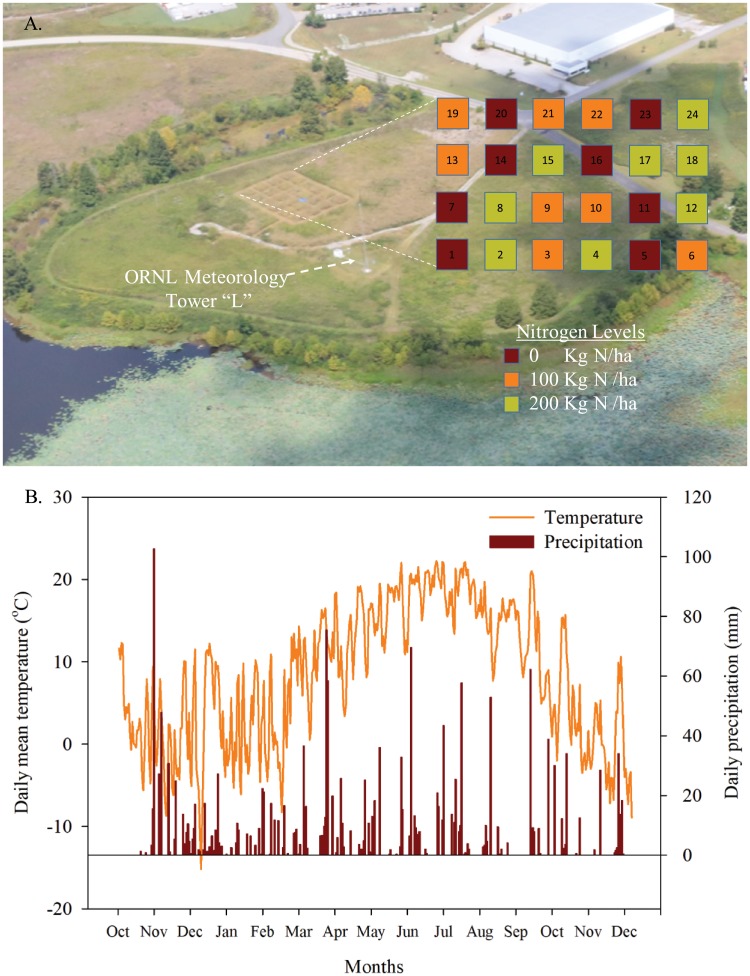
Fig 1.
A. An ariel photograph from August 2018 showing the layout of twenty four plots (5 m × 5 m) with three N fertilization levels (0, 100, and 200 kg N ha-1) and eight replicates based on a complete randomized design. B. Daily mean temperature and precipitation (November 2016 to December 2017) from the adjacent meteorological tower in Oak Ridge, Tennessee, USA.

