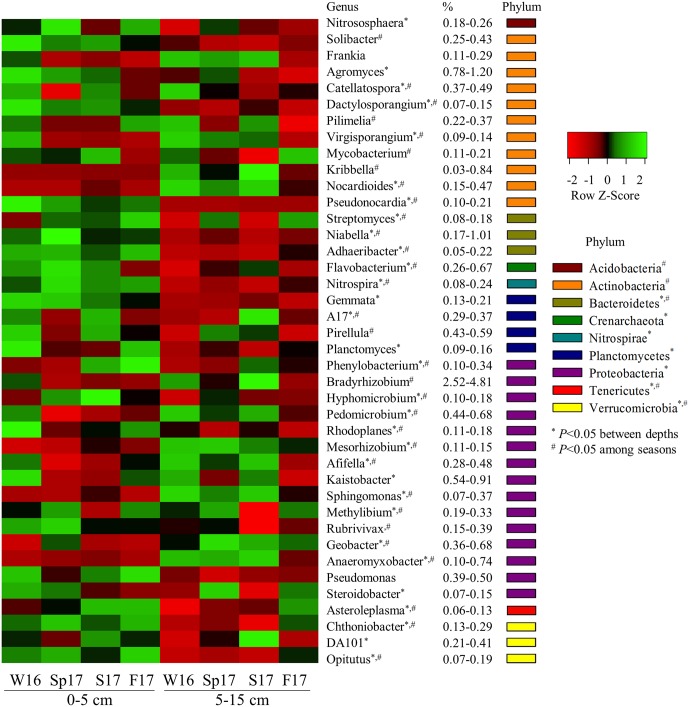
Fig 6. A heat map of relative abundance of bacterial/archaeal dominant taxonomic groups at genus level (average abundances > 0.1%) that were significantly variable between two soil depths (0–5 and 5–15 cm) and over four sampling seasons (Winter 2016, Spring, Summer, and Fall 2017).
Asterisks indicate significant difference between two soil depths (0–5 and 5–15 cm) at α = 0.05. Number signs indicate significant difference over four sampling seasons (Winter 2016, Spring, Summer, and Fall 2017) at α = 0.05.

