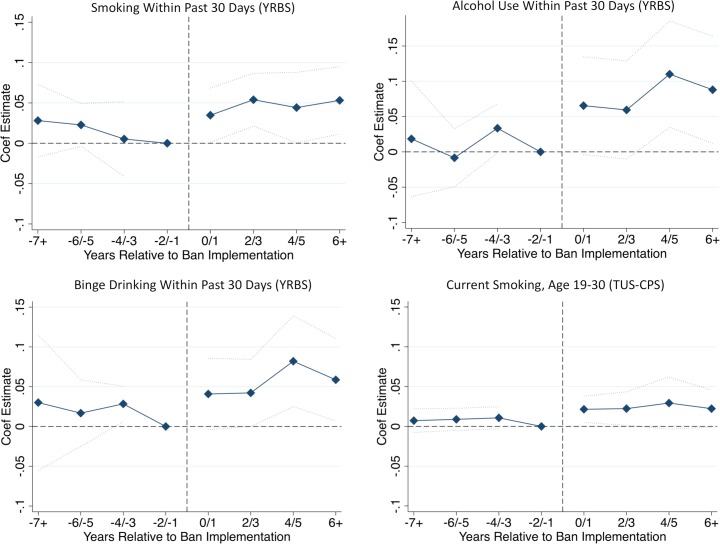
Fig 2. Event study estimates for underrepresented minority respondents.
Graphs present event study estimates for underrepresented minority respondents in the YRBS and TUS-CPS. The regression models are identical to those presented in Table 2, except the exposure variable is replaced by a series of binary indicators denoting the timing of interview (or when the individual turned 16 years of age) relative to the policy change. Individuals in states not passing bans were assigned 0 for each of the bins. The 2-year period before ban implementation (event time −2/−1) was denoted as the reference period. The blue diamonds compare the difference in the prevalence of the outcome (“Coef Estimate”), for each point in event time relative to the reference period, between individuals living in states where an affirmative action ban was implemented versus individuals living in states where a ban was not implemented. The dotted blue lines represent 95% confidence intervals, which account for clustering at the state level. There is a confidence interval for the event time period right before ban implementation given that this was denoted as the reference period. Estimates for non-Hispanic White individuals are presented in S2 Fig. TUS-CPS, Tobacco Use Supplement to the Current Population Survey; YRBS, Youth Risk Behavior Survey.

