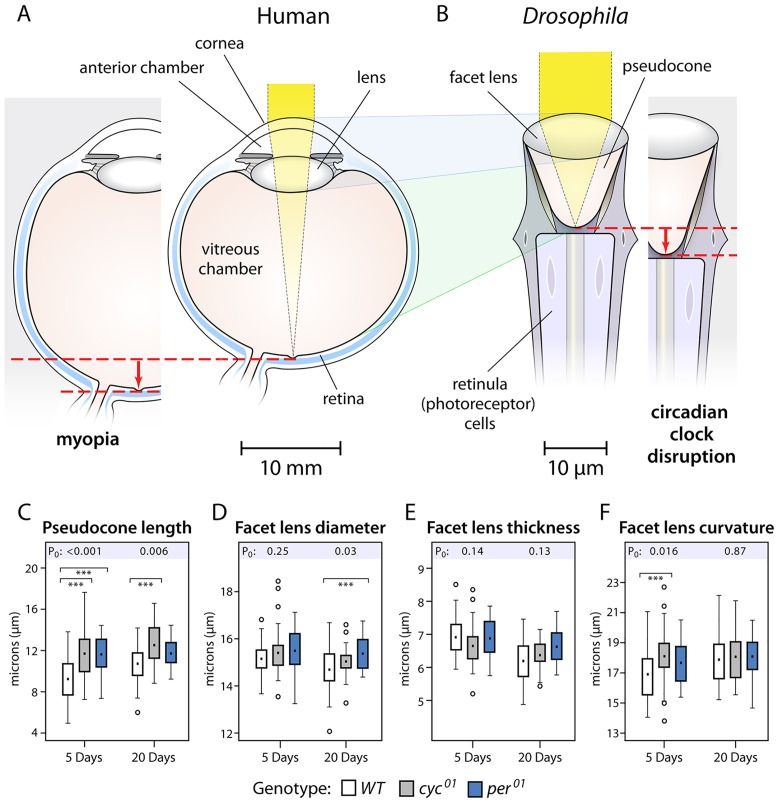
Fig 3. Circadian clock disruption and the morphology of the anterior part of Drosophila ommatidia.
A & B. Schematic drawings comparing the human eye and clinical myopia to the Drosophila ommatidium in flies without and with a clock gene knockout. The cornea-(anterior chamber)-lens complex of the human eye (A) corresponds to the facet lens of the Drosophila ommatidium (B); the human vitreous chamber, to the Drosophila pseudocone. These optical components focus incoming light on the human retina or on Drosophila retinula cells. Human myopia most commonly results from vitreous chamber elongation (A, left). Clock gene mutations result in lengthened pseudocones (B, right), paralleling the main abnormality in human myopia. Dashed red lines and arrows facilitate comparison of the normal to altered structures in both species. Magnification bars illustrate the marked scale differences between the imaging structures of these species. C. At 5 days of age, the pseudocone length is greater in flies with null mutations of the clock genes cycle or period (cyc01 or per01), relative to control wildtype (WT) flies. At 20 days, the pseudocone lengthening remained statistically significant for the cyc01 flies but became a trend for the per01 flies (p = 0.07). D. The facet lens diameters are not affected at 5 days; at 20 days, the facet lens in per01 but not cyc01 flies was modestly wider than in WT flies. E. Facet lens thicknesses were unaffected at either age. F. The radius of curvature of the facet lens was longer in mutants compared to WT flies at 5 days; by post hoc testing, this lengthening reached statistical significance for the cyc01 flies. By 20 days, the curvature effect was no longer evident. For each cohort, the numbers of flies and ommatidium regions measured appear in S4 and S5 Tables. Box plots: solid squares, means; rectangular area, 25–75 percentiles; fences, 1.5X (interquartile range); open circles, outliers. P0, p-values of the overall statistical effect for each group. Bars, within-age statistically significant comparisons by post hoc testing: ***p≤0.001. Data appear in S4 and S5 Tables.

