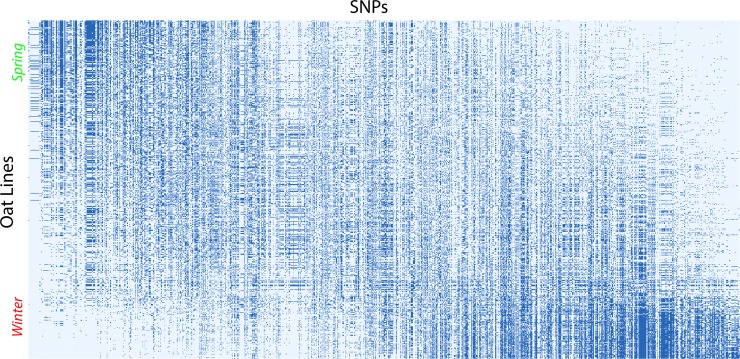
Fig 2. CA1 arranged matrix for 635 oat lines in rows and 1341 SNPs in columns.
Spring oats are concentrated at the top of this matrix, and winter oats at the bottom. Correspondingly, SNPs at the left have high percentages of the rare allele in spring oats, and SNPs at the right have high percentages of the rare allele in winter oats.

