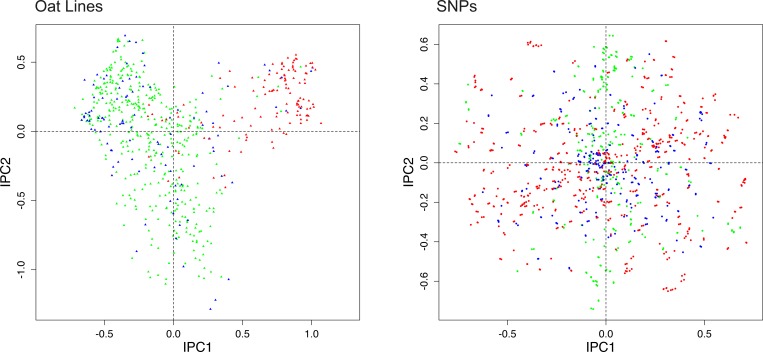
Fig 5. DC-PCA biplot for the oat data, using SNP coding mixed, namely the received data.
The color scheme is the same as in Fig 1, namely spring oats show in green, world diversity oats in blue, and winter oats in red, with corresponding colors for the SNPs. The contrast between spring and winter oats is clear for Individuals in the left panel, but the corresponding pattern for SNPs in the right panel has been obliterated by thorough intermixing of the three colors of points.

