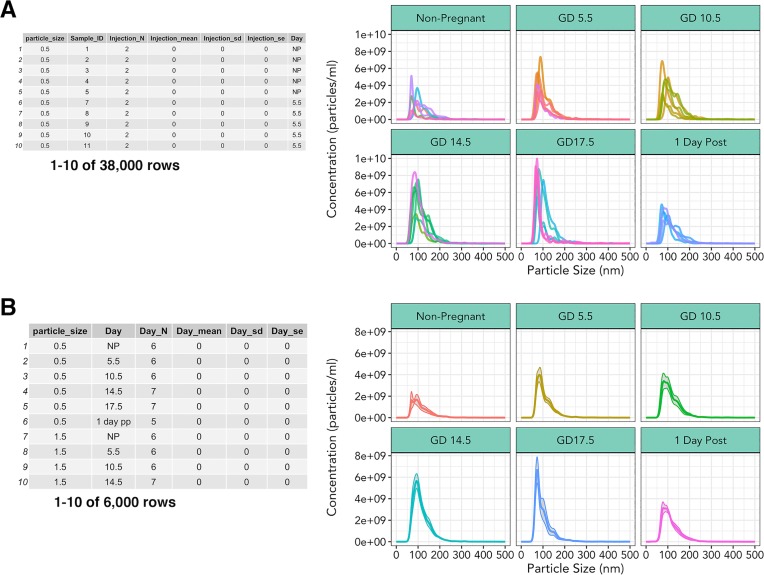
Fig 4. Multiparameter summary statistics and visualization.
(A) Output from nanolyze() which calculates mean, standard deviation, and standard error within specified groups. Corresponding line graph of exosome concentration as a function of size, split by gestational age, different colored lines within each group represent a single biological replicate. (B) Summarization of biological replicate data from nanolyze() of 3(A) data. Corresponding line graph depicting mean exosome concentration of biological replicates as a function of size, grey area surrounding lines represent standard error of the mean.

